 Back to Resources
CRE Pulse: National & Gulf Coast Market Trends
☕ Good Morning!
Real estate has a funny way of keeping everyone humble. One day, you're waiting for the perfect offer; the next, your lender wants a conversation. Buyers are crunching numbers, owners are weighing their options, and investors are hunting for markets where the fundamentals do more than look good on paper. Meanwhile, Florida's Gulf Coast is reminding everyone that sometimes the most interesting opportunities aren't in the usual places. This week, we're skipping the crystal ball and getting down to what really moves commercial real estate: pricing, pressure, and knowing when the numbers finally make sense.
CBRE's Deal Machine Hits a Speed Bump: Higher Rates Crash the Party
🏢 A Record Quarter Meets a Reality Check
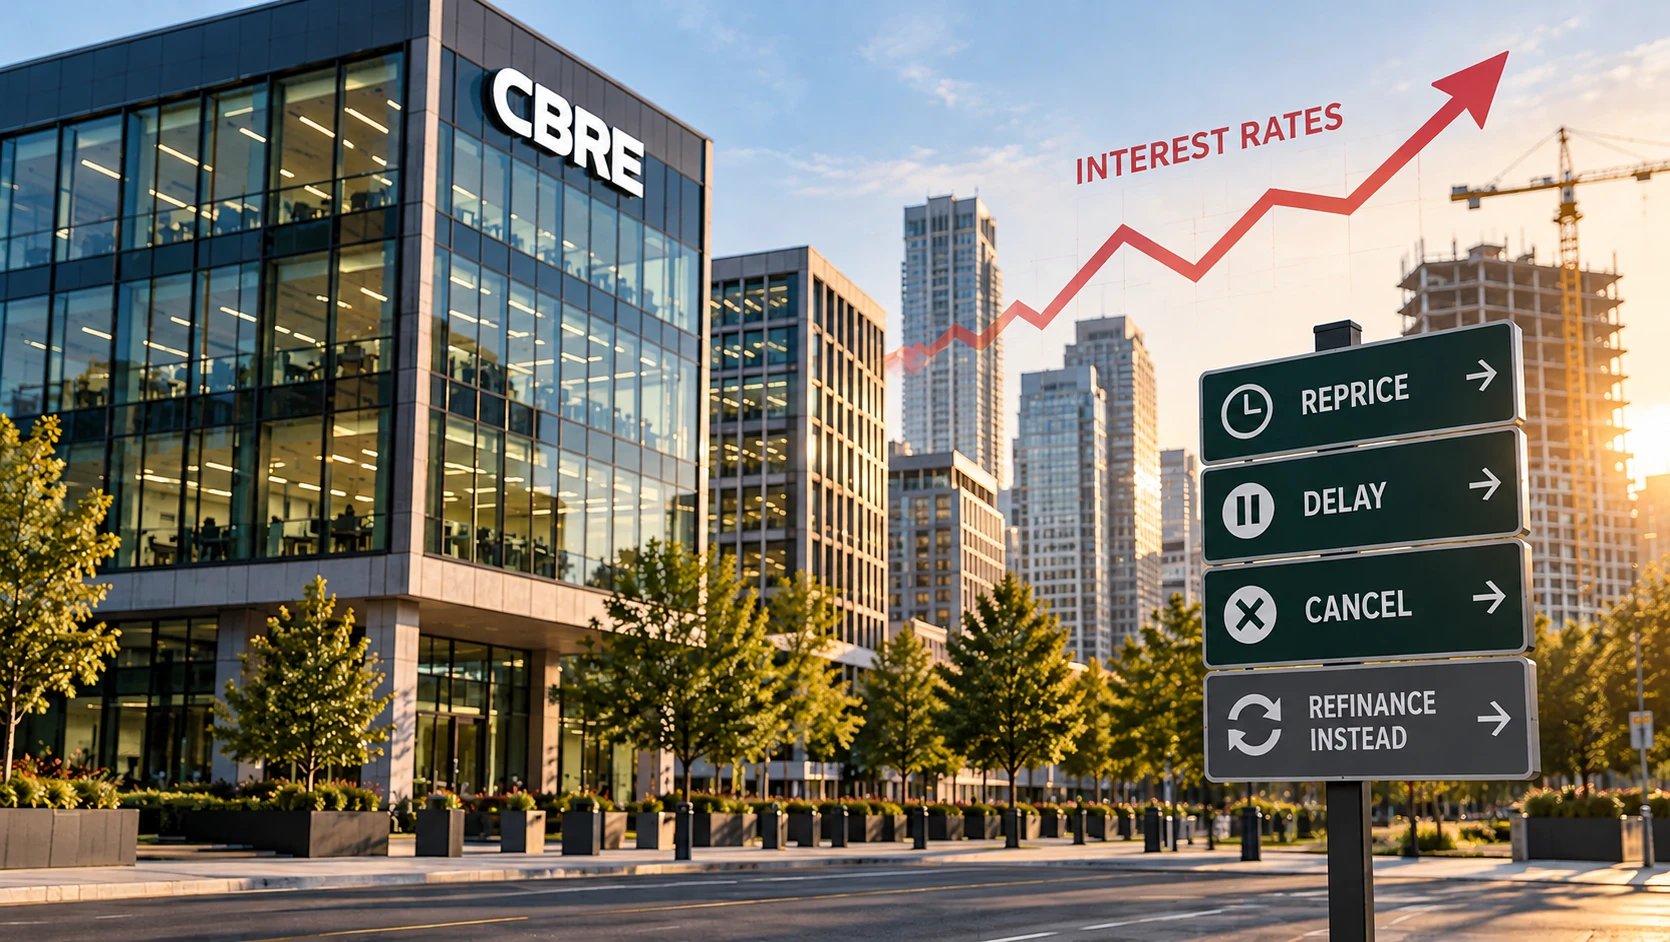
CBRE had a pretty good third quarter. Unfortunately, interest rates didn't get the memo.
The world's largest commercial real estate services firm reported a 13% jump in revenue to $11.5 billion and a 22% increase in net income to $443 million. Global property sales revenue surged 28%, with US sales climbing 37%, thanks to strong industrial and retail activity.
Then came the plot twist: Rising interest rates and uncertainty over where they're headed are starting to put the brakes on dealmaking.
📝 Sign Here... Actually, Let's Reprice That.
According to CBRE Chair and CEO Bob Sulentic, deals already under contract are being repriced, some transactions are falling apart, and anticipated property sales are turning into refinancing arrangements instead.
Translation: Buyers and sellers are struggling to agree on what properties are worth when borrowing costs keep everyone guessing.
CBRE executives also reported slower capital markets activity in September, with weakness potentially extending into 2027. Sulentic suggested uncertainty could ease in the second half of next year—but, as he acknowledged, nobody has a crystal ball.
🤖 One Door Closes, Another Data Center Opens
CBRE isn't putting all its eggs in the transaction basket. Its data center infrastructure business saw revenue surge 80%, driven by demand from major technology companies and strategic acquisitions.
The firm recently added Onnec Group to its growing portfolio and expects critical infrastructure services to generate nearly $4.5 billion in revenue in 2027. Its broader infrastructure services business is projected to approach $7 billion.
© The Takeaway: Dealmakers, Meet Delay-Makers
CBRE's results show a CRE market with two competing realities: strong underlying business performance and growing friction in property transactions.
For investors, developers, and brokers, the message is clear: Higher rates don't just make financing more expensive—they can change whether a deal happens at all.
Until the interest-rate fog lifts, patience may be the most valuable asset on the balance sheet.
Multifamily's Next Big Deal? A Landlord Who's Run Out of Time
🏦 Lenders Are Getting Impatient—and Buyers Are Taking Notes
Multifamily investors have been waiting for sellers to blink. Now, some landlords may be getting a little nudge from the people holding their mortgages.
At the GlobeSt. Multifamily Owners Forum 2026 in San Diego, executives from Hamilton Zanze, Virtu Investments, and StarPoint Properties described a market where lender pressure is pushing more owners to consider selling. That pressure has intensified over the past six to nine months, creating potential openings for buyers looking for more attractive pricing.
But before investors break out the champagne, there's a catch: Not every owner is desperate to sell.
The Real Estate Version of Chicken
Owners facing refinancing challenges or financial constraints have less leverage to hold out for higher prices. Meanwhile, well-capitalized landlords can afford to wait for better conditions.
As Virtu Investments CIO Ritesh Patel put it, both sides are playing a waiting game. Hamilton Zanze CEO Kurt Houtkooper echoed the divide: Just because an owner recognizes today's lower property values doesn't mean they're willing to accept them.
Translation? A seller who needs to transact is a very different negotiating partner from one who can comfortably sit tight.
© Forget the Fire Sale. Think Selective Shopping.
StarPoint Properties CEO Paul Daneshrad poured some cold water on expectations of a sweeping buying bonanza. Unlike previous acquisition cycles fueled by falling interest rates and rising momentum, today's market lacks the same tailwinds.
Still, opportunities exist for investors willing to dig into individual deals. The winning strategy may be less "buy everything" and more "find the landlord whose timeline just changed."
The takeaway: Multifamily's next wave of deals may hinge less on a market-wide price correction and more on individual owners' financial flexibility. For buyers, patience matters—but knowing who needs to sell could matter even more.
Fort Walton Beach: The Emerald Coast's Next Big Opportunity
🏭 Beach Town, Business Boom: Investors Are Taking Notice
Fort Walton Beach may be famous for sugar-white sand and turquoise water, but its industrial market is making waves of its own. Backed by military spending, tourism, a skilled workforce, and strategic transportation links, the Crestview–Fort Walton Beach–Destin metro is quietly building a compelling case for industrial real estate investors.
The region's economy grew 3.1% in 2025, with Oxford Economics forecasting average annual growth of 2.3% through 2030. At the center of the story is Eglin Air Force Base, which generates more than $9 billion in annual economic impact and supports over 74,000 jobs. Add a steady pipeline of transitioning service members, aerospace and defense contractors, and regional educational institutions, and the workforce equation starts looking pretty attractive.
📊 The Numbers Are Doing Some Heavy Lifting
Industrial transaction activity has accelerated well beyond historical norms. Over the past year, 50 industrial properties traded, representing 610,000 square feet of inventory turnover. That compares with average annual turnover of just 82,000 square feet over five years and 91,000 square feet over ten years.
Sales volume tells a similar story: $71.4 million over the past year, nearly double the five-year annual average of $38 million.
And pricing? That's where things get interesting.
💰 Lower Entry Prices, Higher Yield Potential?
Estimated industrial pricing sits at $118 per square foot, versus $160 nationally. Logistics properties average $119/SF, flex assets $160/SF, and specialized buildings $92/SF.
The estimated market cap rate is 9.3%, compared with 7.4% nationally. That spread could catch investors' attention, although higher cap rates can also reflect greater perceived risk, market liquidity, or property-specific challenges. In other words, the yield looks tempting—but the due diligence still needs to earn its keep.
🚚 Connectivity Is the Secret Sauce
Three airports, proximity to Interstate 10, access to the Intracoastal Waterway, and connections to the ports of Pensacola and Panama City support regional commerce. While the metro lacks its own deep-water seaport, its broader transportation network helps bridge local industry with regional logistics.
🎯 The Takeaway: Small Market, Big Potential
Fort Walton Beach combines relatively affordable industrial pricing, elevated cap rates, strong recent transaction activity, and an economic foundation supported by defense and tourism.
For investors, the opportunity may be less about chasing the next major industrial hub and more about finding value in a market where economic fundamentals are stronger than its size might suggest.
The Emerald Coast isn't just open for vacationers. It may be open for business, too.
SALES PAST 12 MONTHS Ft Walton Beach Industrial
RECENT SIGNIFICANT SALES
| # | Property / address | Rating | Year built | Building SF | Vacancy | Sale date | Price | Price/SF | Cap rate |
|---|---|---|---|---|---|---|---|---|---|
| 1 | Builders FirstSource 205 Progress Ln | ⭐⭐⭐☆☆ | 2023 | 51,000 | 0% | 2/25/2026 | $7,825,000 | $153 | - |
| 2 | 306 S Nick Wilson Way | ⭐⭐⭐☆☆ | 2024 | 23,370 | 0% | 4/15/2026 | $6,000,000 | $257 | - |
| 3 | 12870 US Hwy 98 | ⭐⭐⭐☆☆ | 1995 | 28,497 | 0% | 1/30/2026 | $5,200,000 | $182 | - |
| 4 | 106 N Geronimo St | ⭐⭐☆☆☆ | 2004 | 28,757 | 0% | 10/28/2025 | $4,350,000 | $151 | - |
| 5 | 218 S Nick Wilson Way | ⭐⭐⭐☆☆ | - | 14,321 | 0% | 9/3/2026 | $3,000,000 | $209 | - |
| 6 | 1147 S Ferdon Blvd | ⭐⭐⭐☆☆ | 1986 | 13,027 | 0% | 3/25/2026 | $2,875,000 | $221 | - |
| 7 | 424 College Blvd | ⭐⭐⭐☆☆ | 2016 | 22,812 | 0% | 11/5/2025 | $2,800,000 | $123 | - |
| 8 | 119 Hollywood Blvd | ⭐⭐☆☆☆ | 1987 | 27,000 | 14.1% | 6/5/2026 | $2,510,000 | $93 | 9.9% |
| 9 | 200 Hart St | ⭐⭐⭐☆☆ | 2008 | 47,906 | 0% | 1/30/2026 | $2,500,000 | $52 | - |
| 10 | 277 Azalea Dr | ⭐⭐☆☆☆ | 1994 | 8,500 | 0% | 8/27/2026 | $2,400,000 | $282 | - |
| 11 | 314 Green Acres Rd | ⭐⭐☆☆☆ | 1985 | 12,350 | 0% | 11/4/2025 | $2,300,000 | $186 | - |
| 12 | 239 Main St | ⭐⭐☆☆☆ | 1978 | 13,131 | 0% | 1/2/2026 | $2,190,000 | $167 | - |
| 13 | 638 Anchors St NW | ⭐⭐☆☆☆ | 1998 | 9,562 | 0% | 5/29/2026 | $2,100,000 | $220 | - |
| 14 | 627 Anchors St NW | ⭐⭐☆☆☆ | 1969 | 16,000 | 0% | 3/11/2026 | $2,100,000 | $131 | - |
| 15 | 605 N County Highway 393 | ⭐⭐☆☆☆ | 2018 | 10,000 | 0% | 10/7/2025 | $2,080,000 | $208 | - |
Panama City Retail: Shoppers Are Showing Up, and Vacancies Are Running Out of Room
🌴 Retail's Got a Gulf Coast Glow-Up
In Panama City, Florida, retail real estate is looking less like an empty storefront and more like a landlord's dream scenario. With vacancy at just 2.0%, rents edging higher, and transaction activity outpacing historical averages, the local market is giving investors plenty to window-shop.
Over the past year, the market absorbed 190,000 square feet of retail space while adding just 110,000 square feet of new inventory. The result? Vacancy fell by 0.5 percentage points, and the year-end 2026 forecast calls for an even tighter 1.9%.
🏢 Some Storefronts Are Harder to Find Than Parking on Black Friday
The tightness is especially striking in certain retail categories:
- Mall space: 0.0% vacancy
- Strip centers: 1.0%
- General retail: 1.8%
- Power centers: 2.8%
- Neighborhood centers: 4.0%
With roughly 380,000 square feet available across an 18.4-million-square-foot market, options remain limited. And new competition isn't exactly flooding in: just 50,000 square feet was under construction in Q4 2026, below the 10-year average of 76,000 square feet.
💰 Rents Are Rising, but the Growth Story Is Maturing
Average market rent stands at $19.50 per square foot, up 1.5% year over year, slightly below the national growth rate of 1.6%.
Power centers are leading the rental-growth race at 2.6%, followed by malls at 2.5% and neighborhood centers at 2.3%. Still, the market's forecast annual rent growth for 2026 is 1.4%, suggesting the rapid gains of earlier years may be cooling. For context, five-year average annual rent growth was 4.1%.
📈 Investors Are Shopping, Too
Over the past year, 81 retail properties traded, representing 650,000 square feet of inventory turnover —well above the market's typical annual activity. Sales volume reached $129 million, compared with a five-year annual average of $106 million.
Estimated pricing sits at $203 per square foot, below the national average of $247. The estimated market cap rate is 6.8%, versus 7.4% nationally. That pricing gap may attract attention, but the lower cap rate also means investors should carefully weigh income potential against acquisition costs and local market risks.
© The Takeaway: Tight Supply Is the Star of the Show
Panama City's retail market combines low vacancy, limited construction, steady rent growth, and above-average recent transaction activity.
For investors and landlords, the opportunity is real—but so is the need to be selective. With little new space on the horizon, well-positioned retail properties could retain a competitive edge. The challenge will be finding assets that justify their price tags as rent growth moderates.
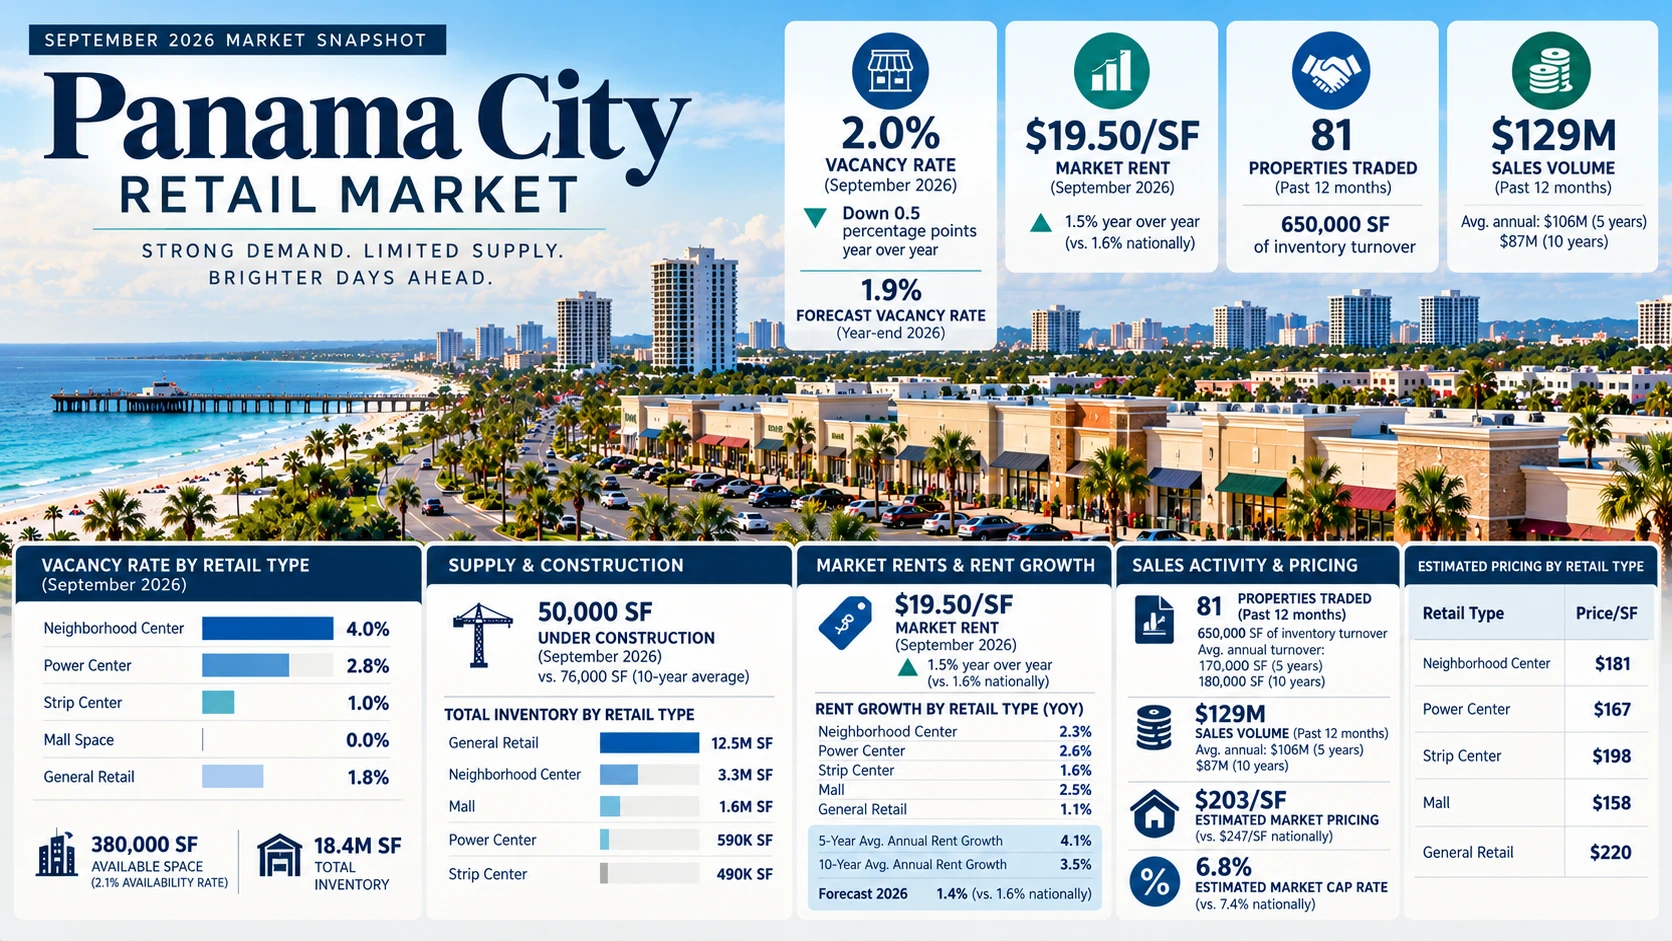
SEPTEMBER 2026 MARKET SNAPSHOT
Panama City — Retail Market
STRONG DEMAND. LIMITED SUPPLY. BRIGHTER DAYS AHEAD.
| Metric | Value |
|---|---|
| VACANCY RATE (September 2026) | 2.0% |
| Down 0.5 percentage points year over year | |
| FORECAST VACANCY RATE (Year-end 2026) | 1.9% |
| MARKET RENT (September 2026) | $19.50/SF |
| 1.5% year over year (vs. 1.6% nationally) | |
| PROPERTIES TRADED (Past 12 months) | 81 |
| 650,000 SF of inventory turnover | |
| SALES VOLUME (Past 12 months) | $129M |
| Avg. annual: $106M (5 years) $87M (10 years) |
| Category | Value |
|---|---|
| VACANCY RATE BY RETAIL TYPE (September 2026) | |
| Neighborhood Center | 4.0% |
| Power Center | 2.8% |
| Strip Center | 1.0% |
| Mall Space | 0.0% |
| General Retail | 1.8% |
| 380,000 SF AVAILABLE SPACE (2.1% AVAILABILITY RATE) | |
| 18.4M SF TOTAL INVENTORY |
| Category | Value |
|---|---|
| 50,000 SF UNDER CONSTRUCTION (September 2026) vs. 76,000 SF (10-year average) | |
| TOTAL INVENTORY BY RETAIL TYPE | |
| General Retail | 12.5M SF |
| Neighborhood Center | 3.3M SF |
| Mall | 1.6M SF |
| Power Center | 590K SF |
| Strip Center | 490K SF |
| Category | Value |
|---|---|
| $19.50/SF MARKET RENT (September 2026) ▲ 1.5% year over year (vs. 1.6% nationally) | |
| RENT GROWTH BY RETAIL TYPE (YOY) | |
| Neighborhood Center | 2.3% |
| Power Center | 2.6% |
| Strip Center | 1.6% |
| Mall | 2.5% |
| General Retail | 1.1% |
| 5-Year Avg. Annual Rent Growth | 4.1% |
| 10-Year Avg. Annual Rent Growth | 3.5% |
| Forecast 2026 | 1.4% (vs. 1.6% nationally) |
| Category | Value |
|---|---|
| 81 PROPERTIES TRADED (Past 12 months) 650,000 SF of inventory turnover Avg. annual turnover: 170,000 SF (5 years) 180,000 SF (10 years) | |
| $129M SALES VOLUME (Past 12 months) Avg. annual: $106M (5 years) $87M (10 years) | |
| $203/SF ESTIMATED MARKET PRICING (vs. $247/SF nationally) | |
| 6.8% ESTIMATED MARKET CAP RATE (vs. 7.4% nationally) |
| Retail Type | Price/SF |
|---|---|
| Neighborhood Center | $181 |
| Power Center | $167 |
| Strip Center | $198 |
| Mall | $158 |
| General Retail | $220 |
Overall Takeaway
Commercial real estate rarely offers a clear-cut signal on when to buy, sell, or hold. With financing costs weighing on transactions, motivated sellers emerging, and local markets showing different strengths, the opportunity often comes down to the individual property rather than the broader headlines.
For owners and sellers, current valuations and refinancing options can help clarify whether holding out for a better price is worth the cost. For buyers, lender pressure may create room to negotiate, but a lower purchase price only matters if the property's income and expenses support the investment. And for investors, markets with tight supply, steady demand, and durable economic drivers deserve a closer look—but higher yields should always be weighed against liquidity and risk.
The common thread? There's no single playbook for this market. Some assets may make sense to sell, others to hold, and others to pursue at the right price. Understanding the property's fundamentals, financing position, and local market conditions can help make that decision clearer.
The best deal isn't necessarily the cheapest one. It's the one that makes sense for your strategy, your capital, and your timeline.
October 27, 2026 · Prepared by Gulf Coast Property Group