
CRE Pulse: Tertiary Markets, IOS & Retail Investment Trends
Commercial real estate continues to show signs of recovery, but the improvement is increasingly uneven across sectors and markets. Industrial demand is strengthening, investment is expanding into tertiary markets, and specialized assets such as industrial outdoor storage are attracting greater institutional interest. At the same time, elevated financing costs, multifamily concessions, and the widening divide within the office market highlight the importance of asset quality, market fundamentals, and disciplined underwriting.
Treasury Buys $6B. Yields Say "Nice Try."
The Treasury just tripled the size of its debt buyback operation. Bond markets responded by... pushing yields higher.
Bigger Buyback, Higher Yields
The U.S. Treasury plans to repurchase $6B of 10- and 20-year notes, three times the usual $2B operation. The goal? Improve liquidity and keep the long end of the Treasury market functioning smoothly.
The market's reaction was less enthusiastic. The benchmark 10-year Treasury yield climbed to 4.841%, reaching its highest level since before the 2008 financial crisis.
Why Aren't Yields Falling?
The buyback is only one piece of a much bigger puzzle. Federal debt has topped $40T, while inflation concerns remain elevated amid tariffs, geopolitical tensions, and oil prices above $100 per barrel.
Those forces are putting upward pressure on long-term yields — and a larger Treasury buyback isn't enough to overpower them on its own. The bigger message: markets are still demanding a meaningful premium to hold long-dated U.S. debt.
Why This Matters
For commercial real estate, this isn't just a bond-market story. The 10-year Treasury is a key benchmark for commercial mortgage pricing, so when long-term yields stay elevated, borrowing costs can remain stubbornly high.
That affects everything from acquisitions and refinancing to property values and cap-rate assumptions. Higher financing costs can also force buyers to underwrite more conservatively, potentially widening the gap between what sellers want and what buyers can afford to pay.
Apartment Concessions Are Easing. Sort Of.
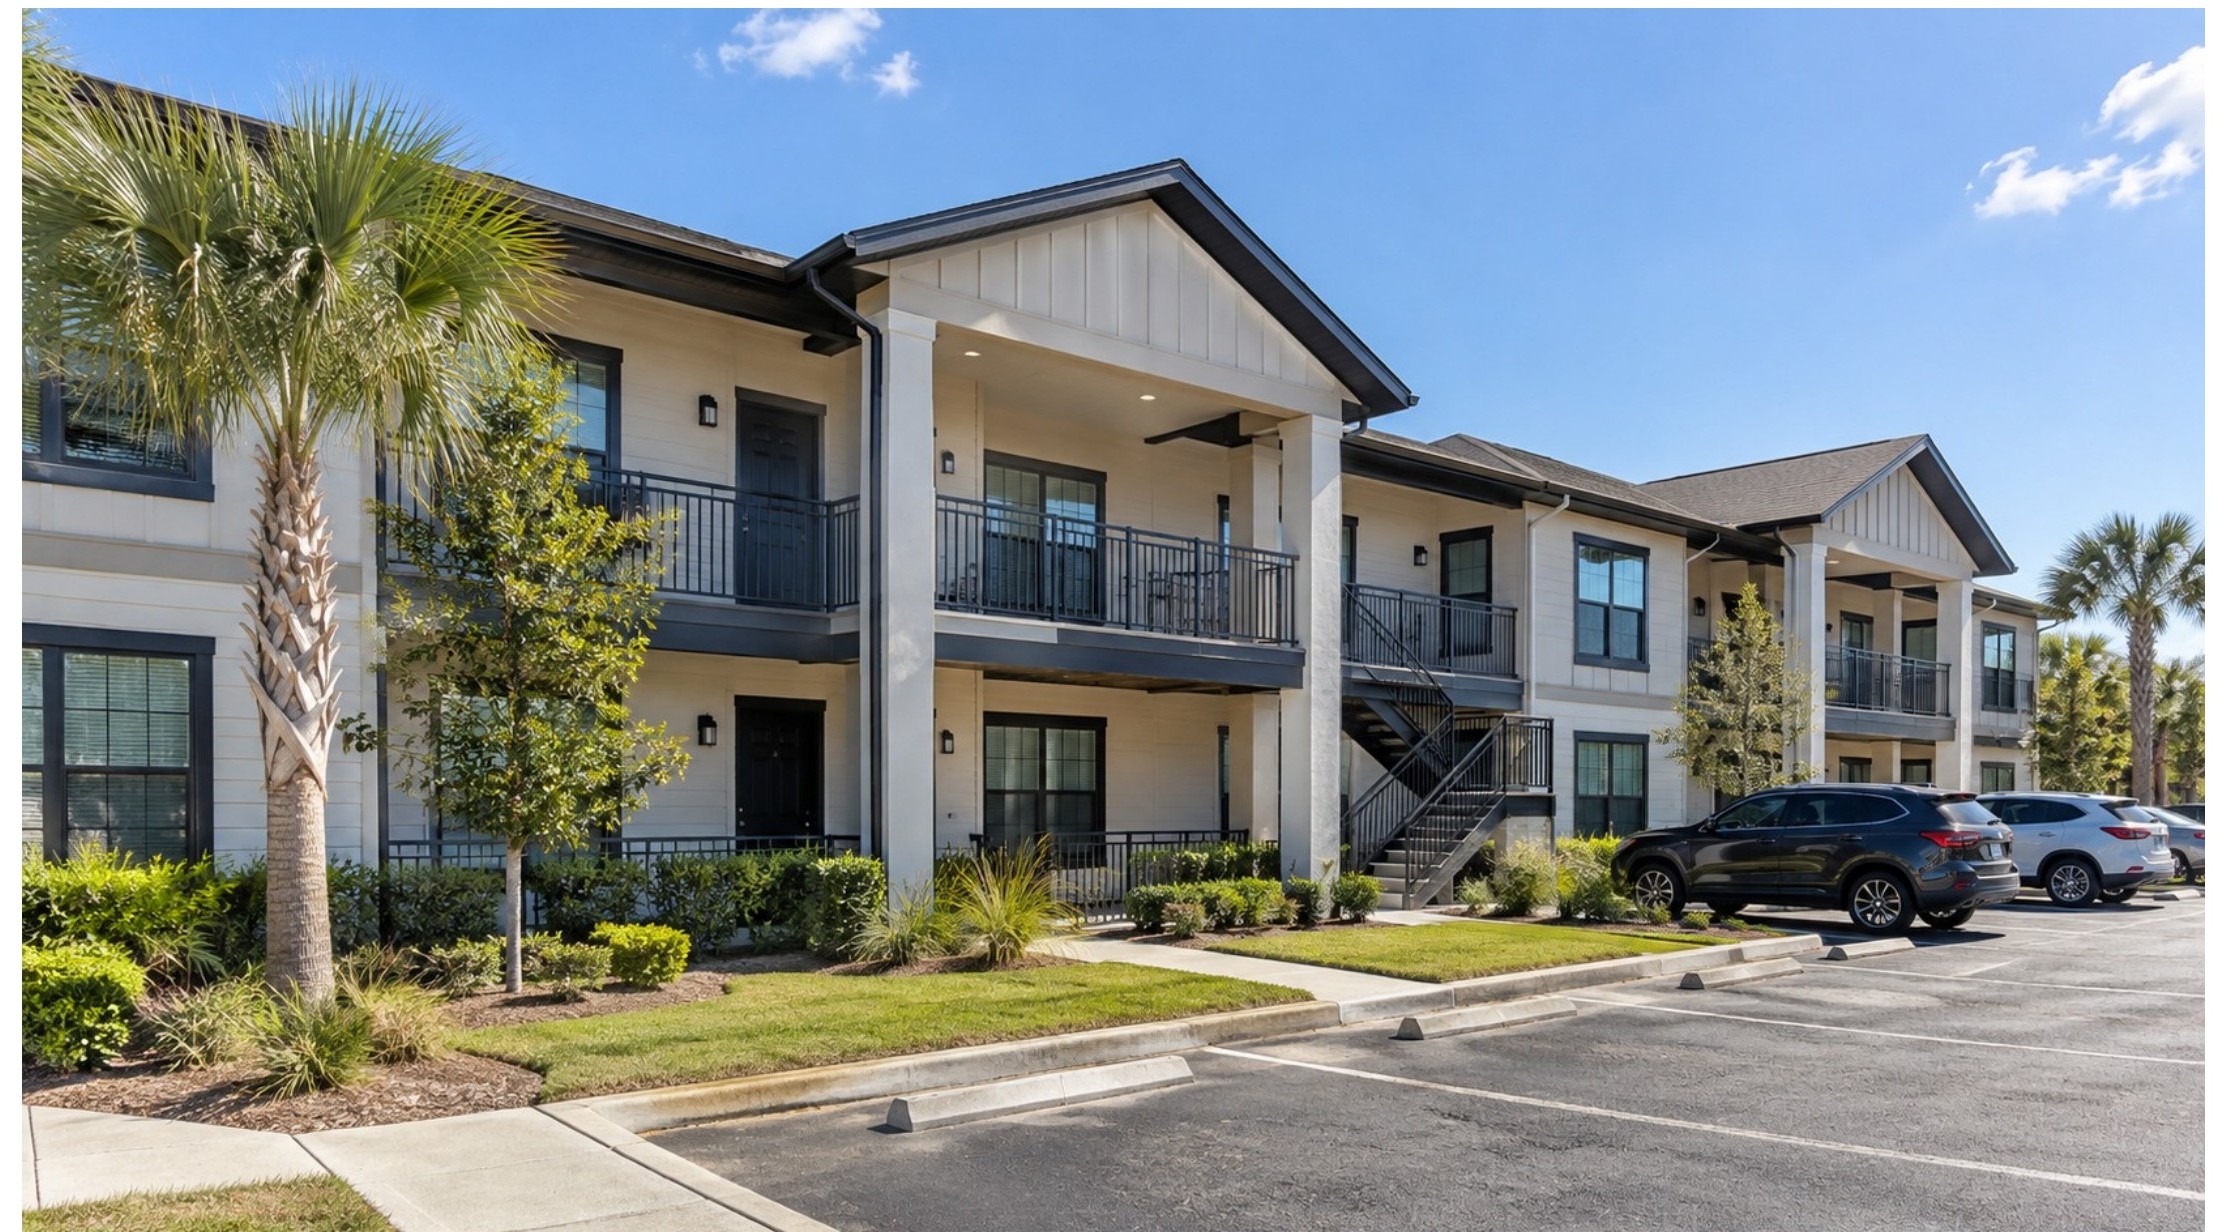
Multifamily operators are finally pulling back on concessions. But before anyone breaks out the champagne, there's a catch: the discounts themselves are still painfully high.
Fewer Freebies, Same Pressure
In July, concessions were offered on 15.8% of stabilized U.S. apartment units, according to RealPage. That marked the first nationwide monthly decline of the summer, with all four major regions seeing concession use fall.
Average concession values remained essentially unchanged, and concession use and discount depth were still above July 2025 levels in every region. So operators appear to be getting more selective about where they offer incentives rather than becoming dramatically more confident about pricing.
The South Is Still Feeling the Heat
The South remains the country's most concession-heavy region, with incentives offered on 21.1% of stabilized units — down 0.8 percentage points from June, but still 4 percentage points higher than a year ago.
The West saw concessions fall to 14.1%, but it had the deepest average discount at 11.9%. Meanwhile, the Midwest looks healthiest, with concessions on just 9% of units.
Texas Has a Concession Problem
Among the 50 largest apartment markets, Austin led the country, with concessions available on 37% of stabilized units. San Antonio followed at 32.6%, while Denver came in at 31.7%.
And Florida isn't exactly handing out tiny coupons. Cape Coral-Fort Myers had the nation's deepest average concession at 17.2%, followed by Naples at 16.5%.
Why This Matters
For multifamily owners, asking rents can tell only half the story. If concessions remain widespread, effective rents can still be significantly below advertised rents — even when headline rent growth looks stable.
That's particularly important for investors underwriting Sun Belt and high-supply markets. A property might appear to be holding the line on rents while quietly giving away a month or more of free rent to get leases signed.
The real signal of a healthier market will come when both concession use AND discount depth decline.
CRE Investors Are Looking Beyond the Big Cities
The biggest cities used to get most of the attention — and plenty of the capital. Now, investors are increasingly taking the scenic route.
Smaller Markets, Bigger Share
Tertiary markets accounted for more than 50% of U.S. CRE deal counts through Q2 2026, according to Marcus & Millichap. That's a major shift from 2010, when tertiary markets represented just 35% of transactions while primary markets accounted for 46.5%. Today, primary markets make up roughly 34%.
And this isn't just a post-pandemic blip. Tertiary markets crossed the 50% threshold in 2023 and have largely stayed there.
Why Investors Are Going Small
The appeal is pretty straightforward: more accessible pricing + higher yields + improving liquidity = more opportunity.
The shift spans nearly every major property type. Tertiary markets now account for 48% of office deals, 58% of single-tenant retail, 52% of multi-tenant retail, and 51% of industrial transactions. Multifamily is following the same direction, with tertiary markets' share climbing from 28% in 2010 to 40% today.
The transaction count tells the story: roughly 7,700 tertiary-market deals in 2010 has become more than 44,000 today.
But There's a Catch
That extra yield isn't as juicy as it once was. Competition has pushed tertiary-market cap-rate premiums lower. Multifamily's spread over primary markets, for example, fell from 210 basis points in 2015 to about 70 bps in 2025.
Why This Matters
The biggest takeaway isn't simply that investors are buying outside major metros. It's that liquidity is changing the risk equation. More transactions mean better price discovery, more comparable sales, and potentially deeper buyer pools when it's time to exit.
Of course, smaller metros still come with risks: shallower buyer pools, smaller economies, and potentially greater dependence on individual employers or industries. But the market is clearly getting more comfortable underwriting those risks.
Holiday Shopping Could Break $1T
Santa may have a record-setting delivery route this year — but retailers shouldn't start celebrating just yet.
$1 Trillion Sounds Great. Here's the Catch.
U.S. holiday sales are expected to rise 4.5% year over year during November and December, according to Bain & Company. That could push holiday spending above $1 trillion for the first time.
But there's a little fine print. More than half of the increase is expected to come from inflation rather than shoppers buying more stuff. With inflation running at 3.4% in July versus 3.1% wage growth, consumers are still feeling the squeeze.
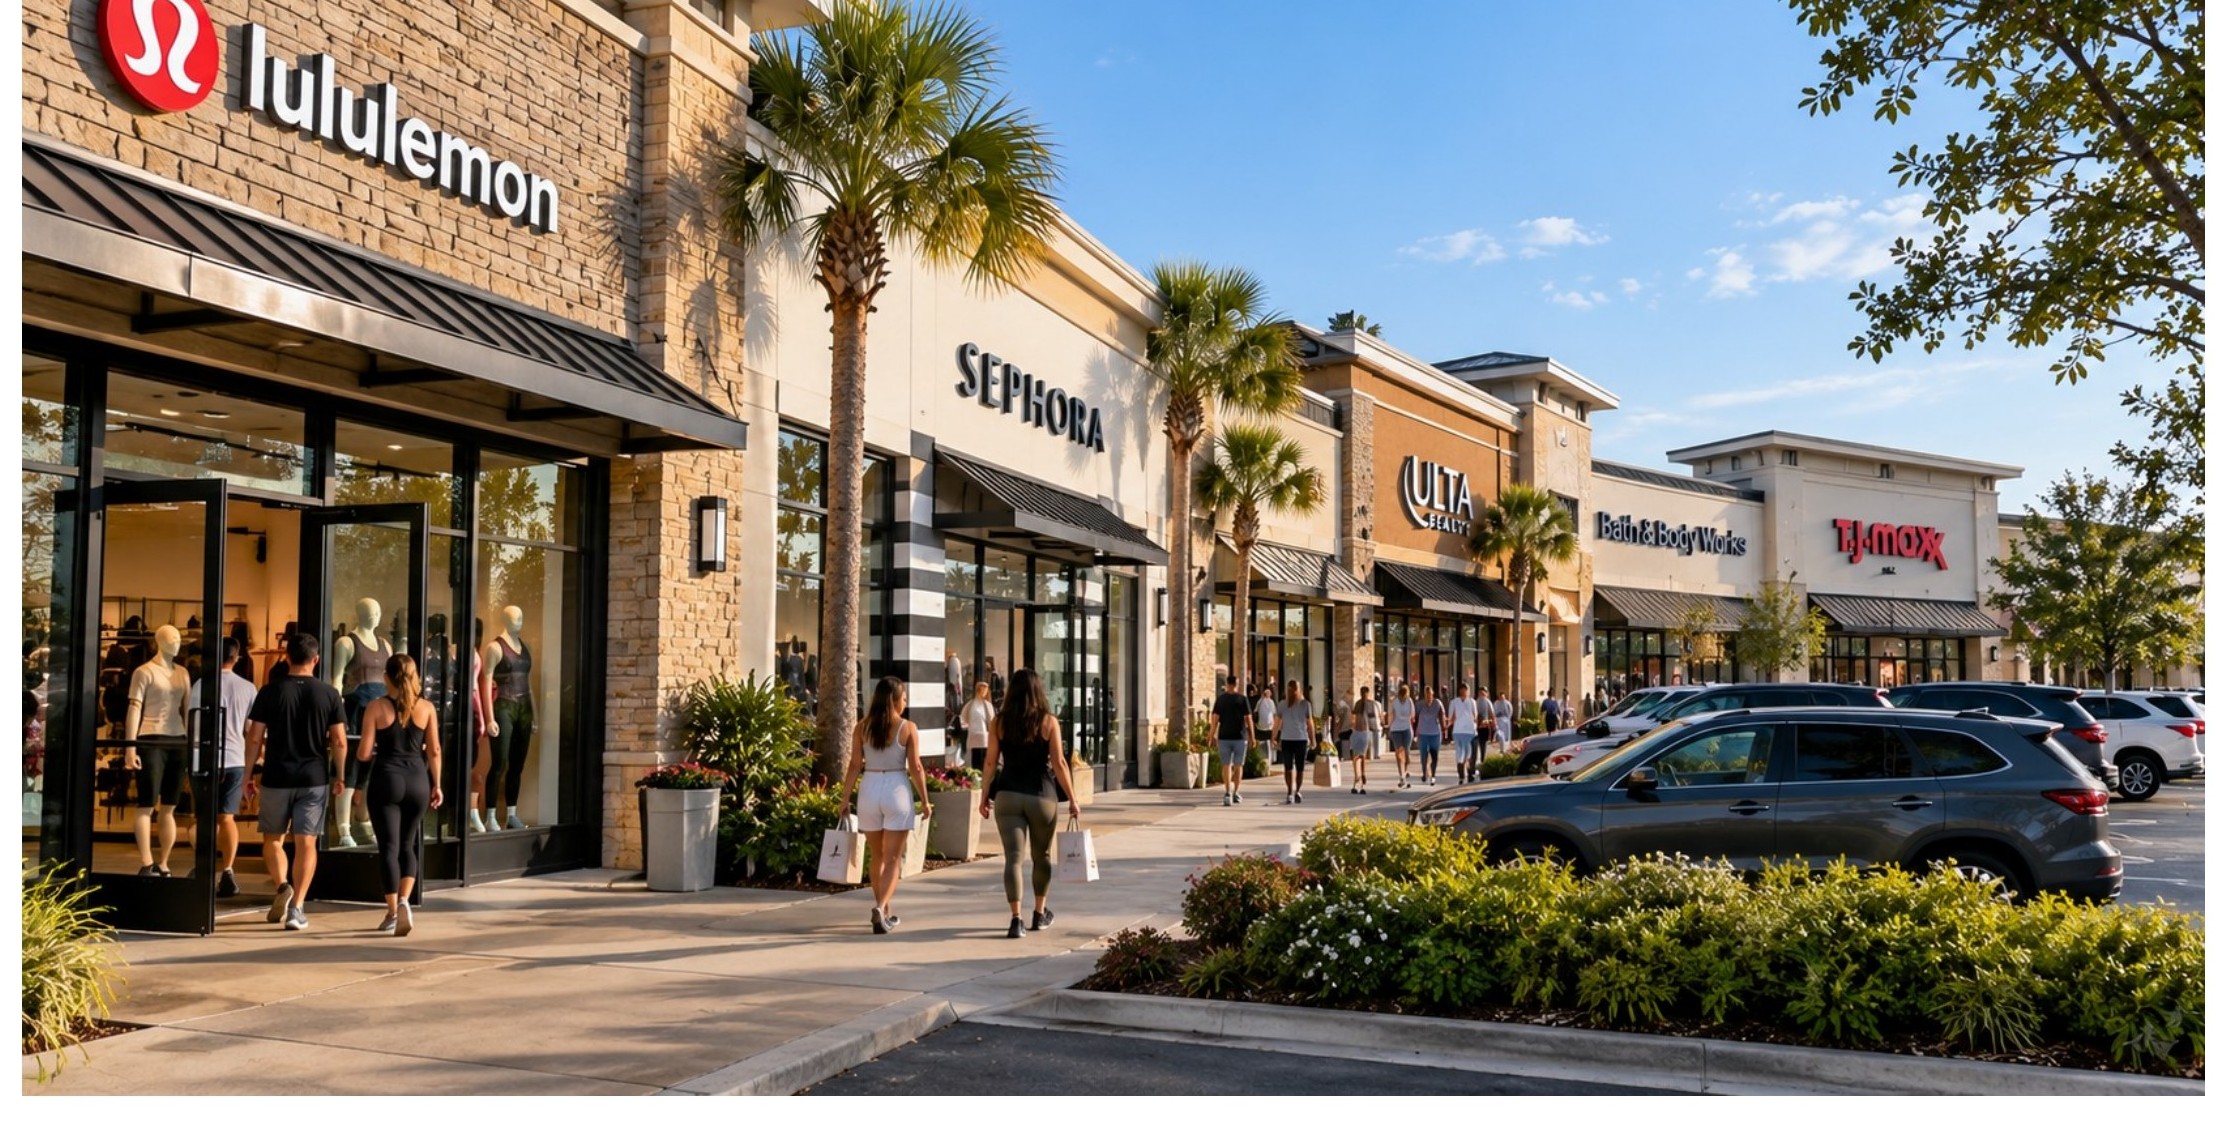
Physical stores will remain hugely important, capturing nearly 70% of total holiday sales. But their sales are expected to grow only 2.5%. Meanwhile, non-store sales — including e-commerce and mail order — are forecast to jump 9% and generate roughly 60% of total holiday sales growth.
The New Holiday Mall Is an AI Chat Window
About 24% of online shoppers plan to start their holiday shopping on an AI platform, up from 17% last year. Another 13% expect to use a retailer's own AI shopping agent. So the battle for holiday dollars increasingly starts before the shopper ever visits a website — or a store.
Why This Matters
For retailers and retail landlords, the headline isn't simply "holiday sales could hit $1T." It's that where and how consumers shop is changing underneath that growth.
Stores still command the majority of spending, but online channels are capturing most of the incremental growth. That makes omnichannel strategy, compelling in-store experiences, promotions, and AI-driven product discovery increasingly important.
Consumers are still opening their wallets. Retailers just have to work harder to get their share — and turn sales growth into actual profit.
Industrial Outdoor Storage Is Having a Moment
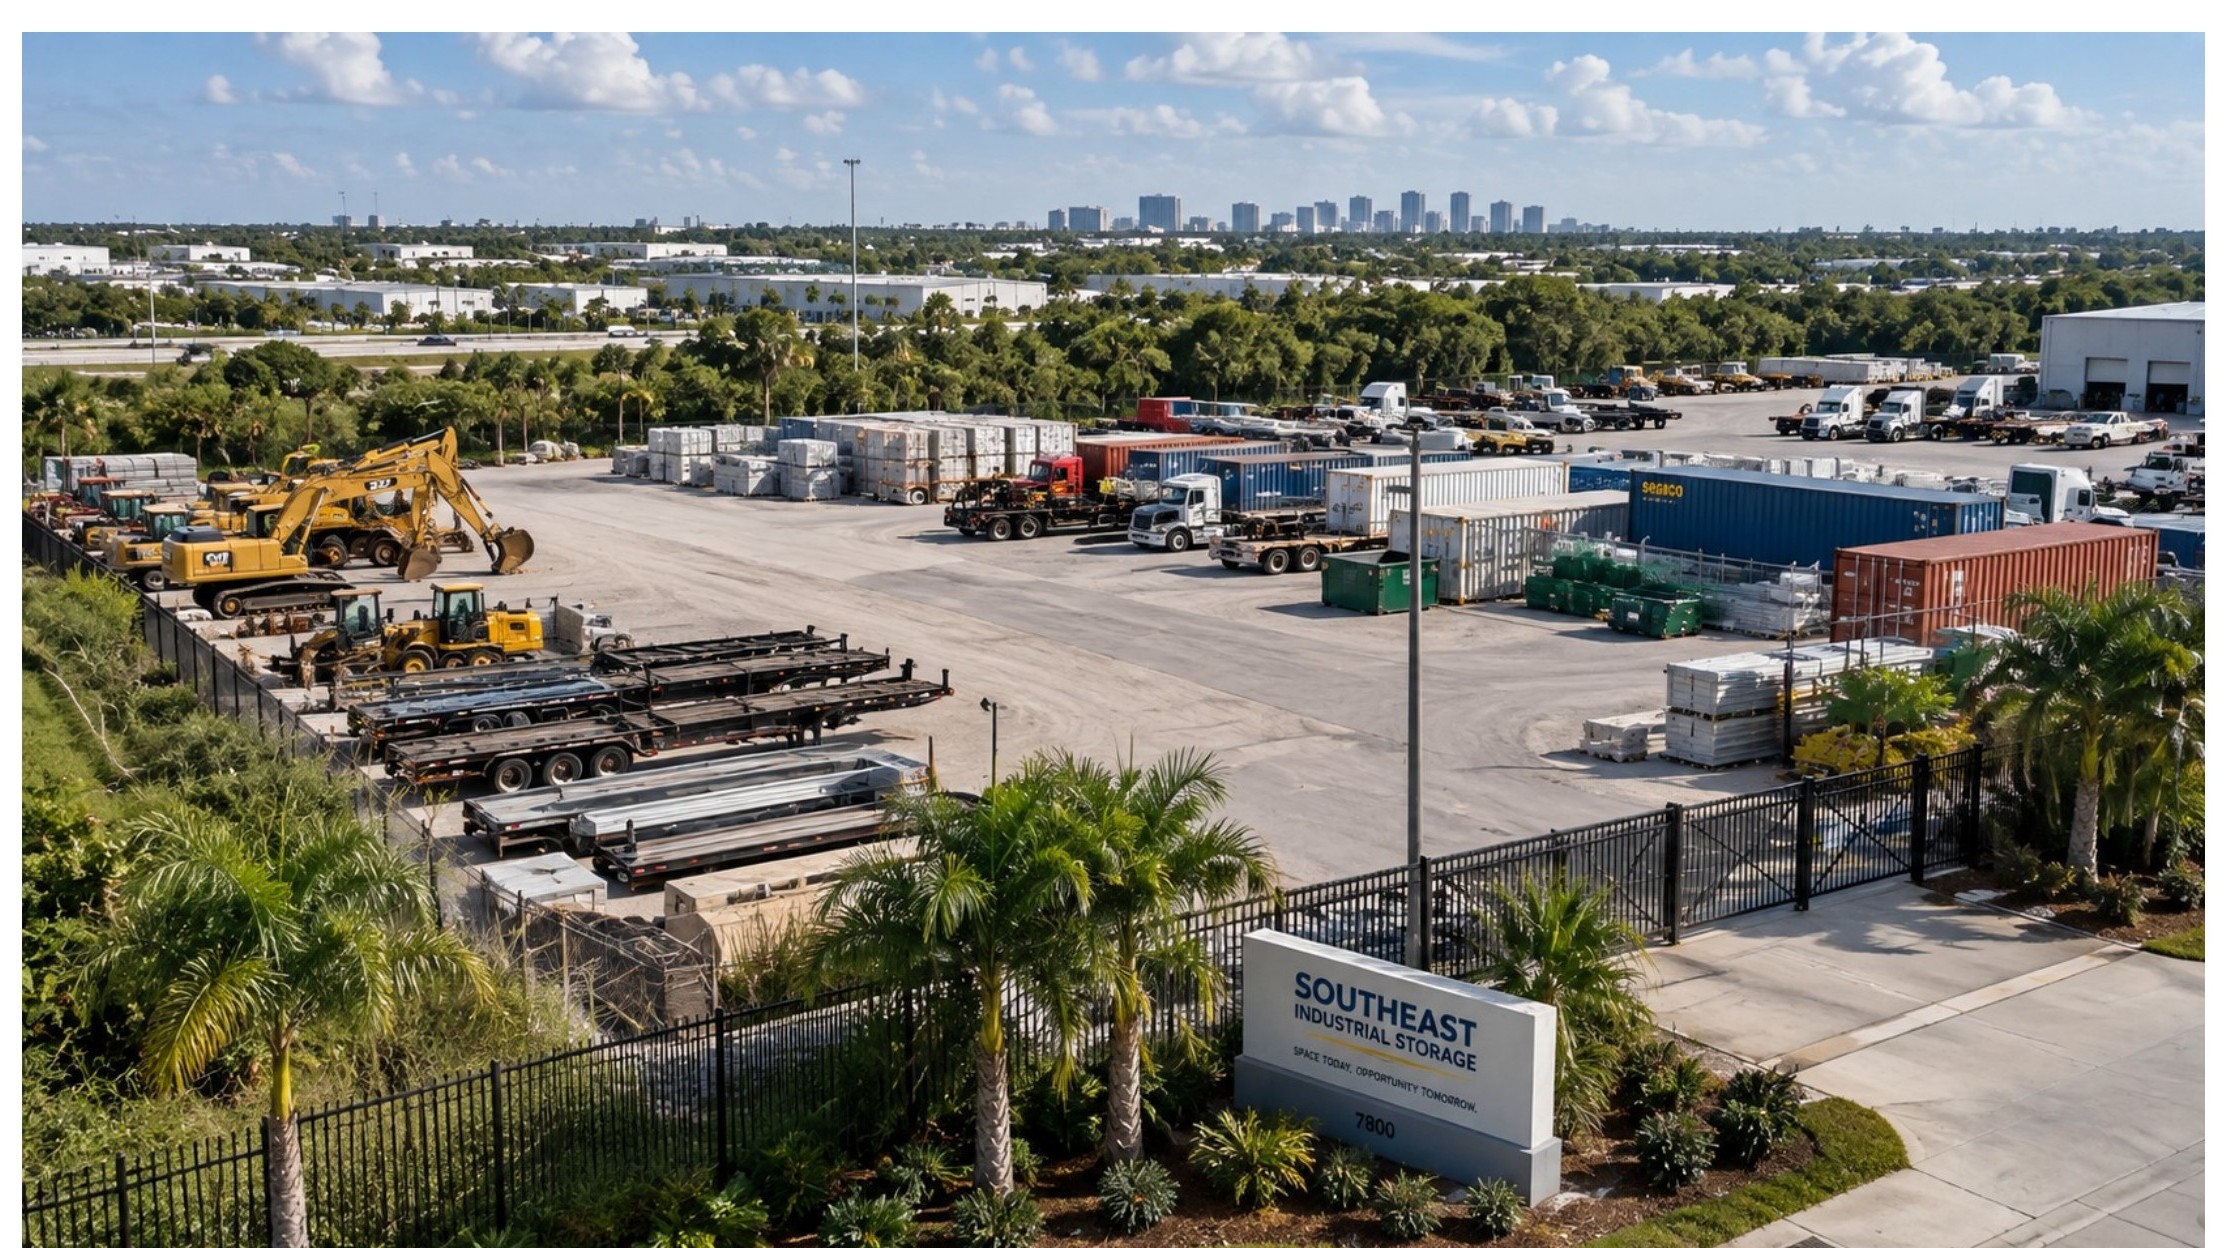
Industrial outdoor storage (IOS) used to be the CRE asset class hiding in plain sight. Now institutional investors are paying attention — and data centers are helping put it on the map.
Big Capital, Tight Supply
Institutional investors now account for 45% of IOS investment, up from just 30% four years ago. Investment volume reached an estimated $14B–$16B in 2025, up 15% from the prior year, with 2026 activity expected to push even higher.
Supply is tight. National IOS vacancy was just 3.6% in Q2 2026, compared with 6.5% for industrial overall. Rents reached $11.07/SF per month, up 1.6% year over year.
AI Is Creating a New Customer
Here's the curveball: data centers now generate roughly 20% of new IOS demand. Data-center developers need places to park heavy equipment, construction materials, power infrastructure, and everything else required to build massive campuses.
And these aren't necessarily short-term needs. Large data-center projects can take years to complete, creating sustained demand for nearby staging and storage sites. Power-grid upgrades and equipment-rental companies are adding another layer of demand.
But Trucking Is Still a Wild Card
Traditional IOS demand hasn't disappeared. Trucking and transportation remain major users. The problem? The trucking industry is dealing with high fuel costs, labor shortages, and weaker operating conditions, and some carriers are shrinking fleets and giving up parking space.
Fortunately, IOS is becoming less dependent on any single tenant category. Data centers, construction, grid infrastructure, equipment rental, and logistics are broadening the demand base.
Why This Matters
IOS is becoming an increasingly institutionalized niche — and that could change how investors think about industrial real estate. The sector offers something increasingly valuable: usable land in locations where there simply isn't much of it.
As institutional capital moves in, larger portfolio deals and deeper financing options could improve liquidity and price discovery. But there's also a risk: more capital chasing a limited amount of IOS could compress yields and push pricing higher.
For investors, the opportunity may be less about simply buying "industrial land" and more about finding strategically located sites tied to durable demand drivers.
Pensacola Retail: Smaller Market, Interesting Numbers
Pensacola may not have the retail transaction volume of a major Sun Belt metro, but the numbers suggest investors are finding plenty to shop for.
180 Properties Changed Hands
Over the past year, 180 retail properties traded in Pensacola, representing approximately 1.4M SF of inventory turnover — well above the market's typical annual pace of roughly 360,000 SF over the past five years and 380,000 SF over the past decade.
Retail sales volume totaled $149M over the past year. That's below the five-year average of $202M and the 10-year average of $171M — but the transaction activity shows there is still meaningful liquidity in the market.
The Price Tag Is the Interesting Part
Estimated retail pricing in Pensacola sits at just $157/SF, compared with a $247/SF national average — roughly 36% below the national benchmark. Pricing also varies significantly by property type:
- Neighborhood centers: $117/SF
- Strip centers: $151/SF
- Mall properties: $118/SF
- General retail: $174/SF
Investors Are Getting Paid for the Risk
Pensacola's estimated retail cap rate is 7.9%, compared with 7.4% nationally — a 50-basis-point premium. In other words, investors aren't just paying less for the real estate; they're also getting a somewhat higher going-in yield.
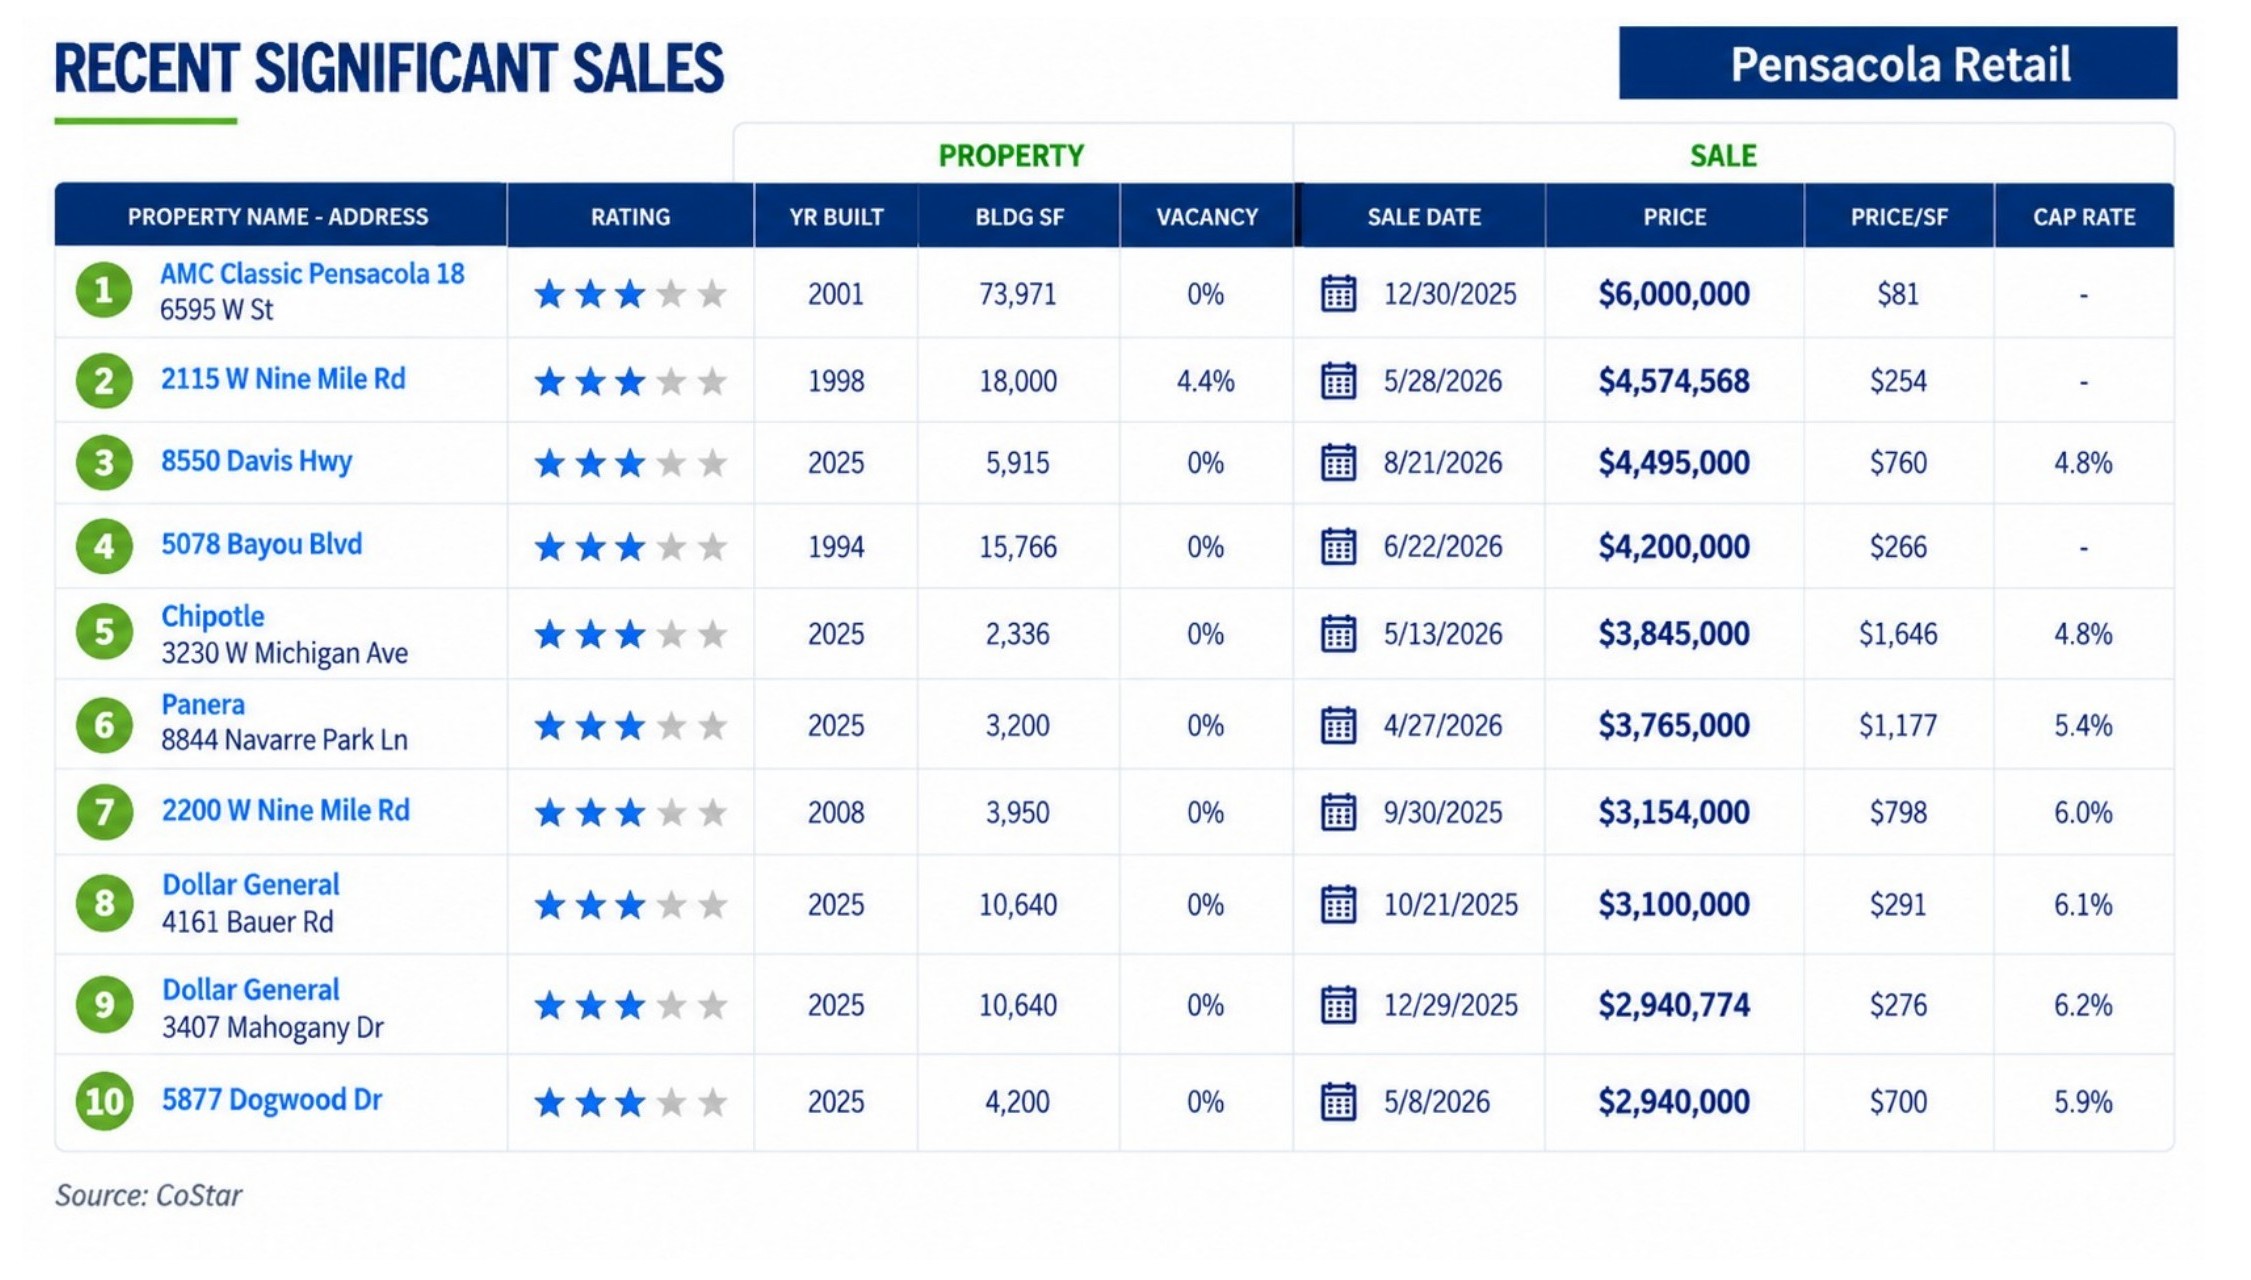
Recent Significant Sales — Pensacola Retail
Why This Matters
Pensacola illustrates why smaller retail markets can deserve a closer look. The market offers a combination of relatively low pricing, a cap-rate premium, and meaningful recent transaction activity. For investors priced out of larger metros, that can create an opportunity to acquire retail at a lower basis while still targeting attractive current yields.
The caveat? Higher yields typically come with higher perceived risk. Investors still need to scrutinize tenant quality, population trends, local employment, liquidity, and exit depth. But with $157/SF pricing versus $247/SF nationally, Pensacola's discount is hard to ignore.
Overall Takeaway
The biggest takeaway from this week's market is that CRE isn't experiencing one recovery — it's experiencing several different ones at once.
Higher-for-longer interest rates are keeping pressure on financing and valuations, while operating fundamentals are improving in select sectors. Industrial demand is accelerating. IOS is attracting institutional capital. Tertiary markets are capturing more than half of CRE deal counts. And Pensacola shows how smaller markets can combine lower pricing with higher going-in yields.
But the weaker spots are equally important. Multifamily concessions remain elevated. Retail sales may hit $1T, but much of that growth is inflation-driven and increasingly shifting online.
The next phase of CRE may be less about "Is the market recovering?" and more about "Which assets are actually benefiting?"
Looking for Your Next CRE Opportunity?
If you're an investor exploring new opportunities or seeking the right CRE partner, we'd love to connect. Call us at (850) 203-5788 or join our investor network at Investment Partnerships.
Prepared by Gulf Coast Property Group