 Back to Resources
September 2026 Gulf Coast Commercial Real Estate Market Update
This week’s CRE Pulse looks at vacancy, asking rents, availability, absorption, deliveries, construction, rent growth, sales volume, and cap rates as of September 2026 across Pensacola, Panama City, Fort Walton Beach, Tallahassee, Jacksonville, and Mobile, AL. The goal is to put the numbers into context and highlight what they may mean for property owners, sellers, buyers, and investors as they evaluate opportunities across the region.
Vacancy Rate (%)
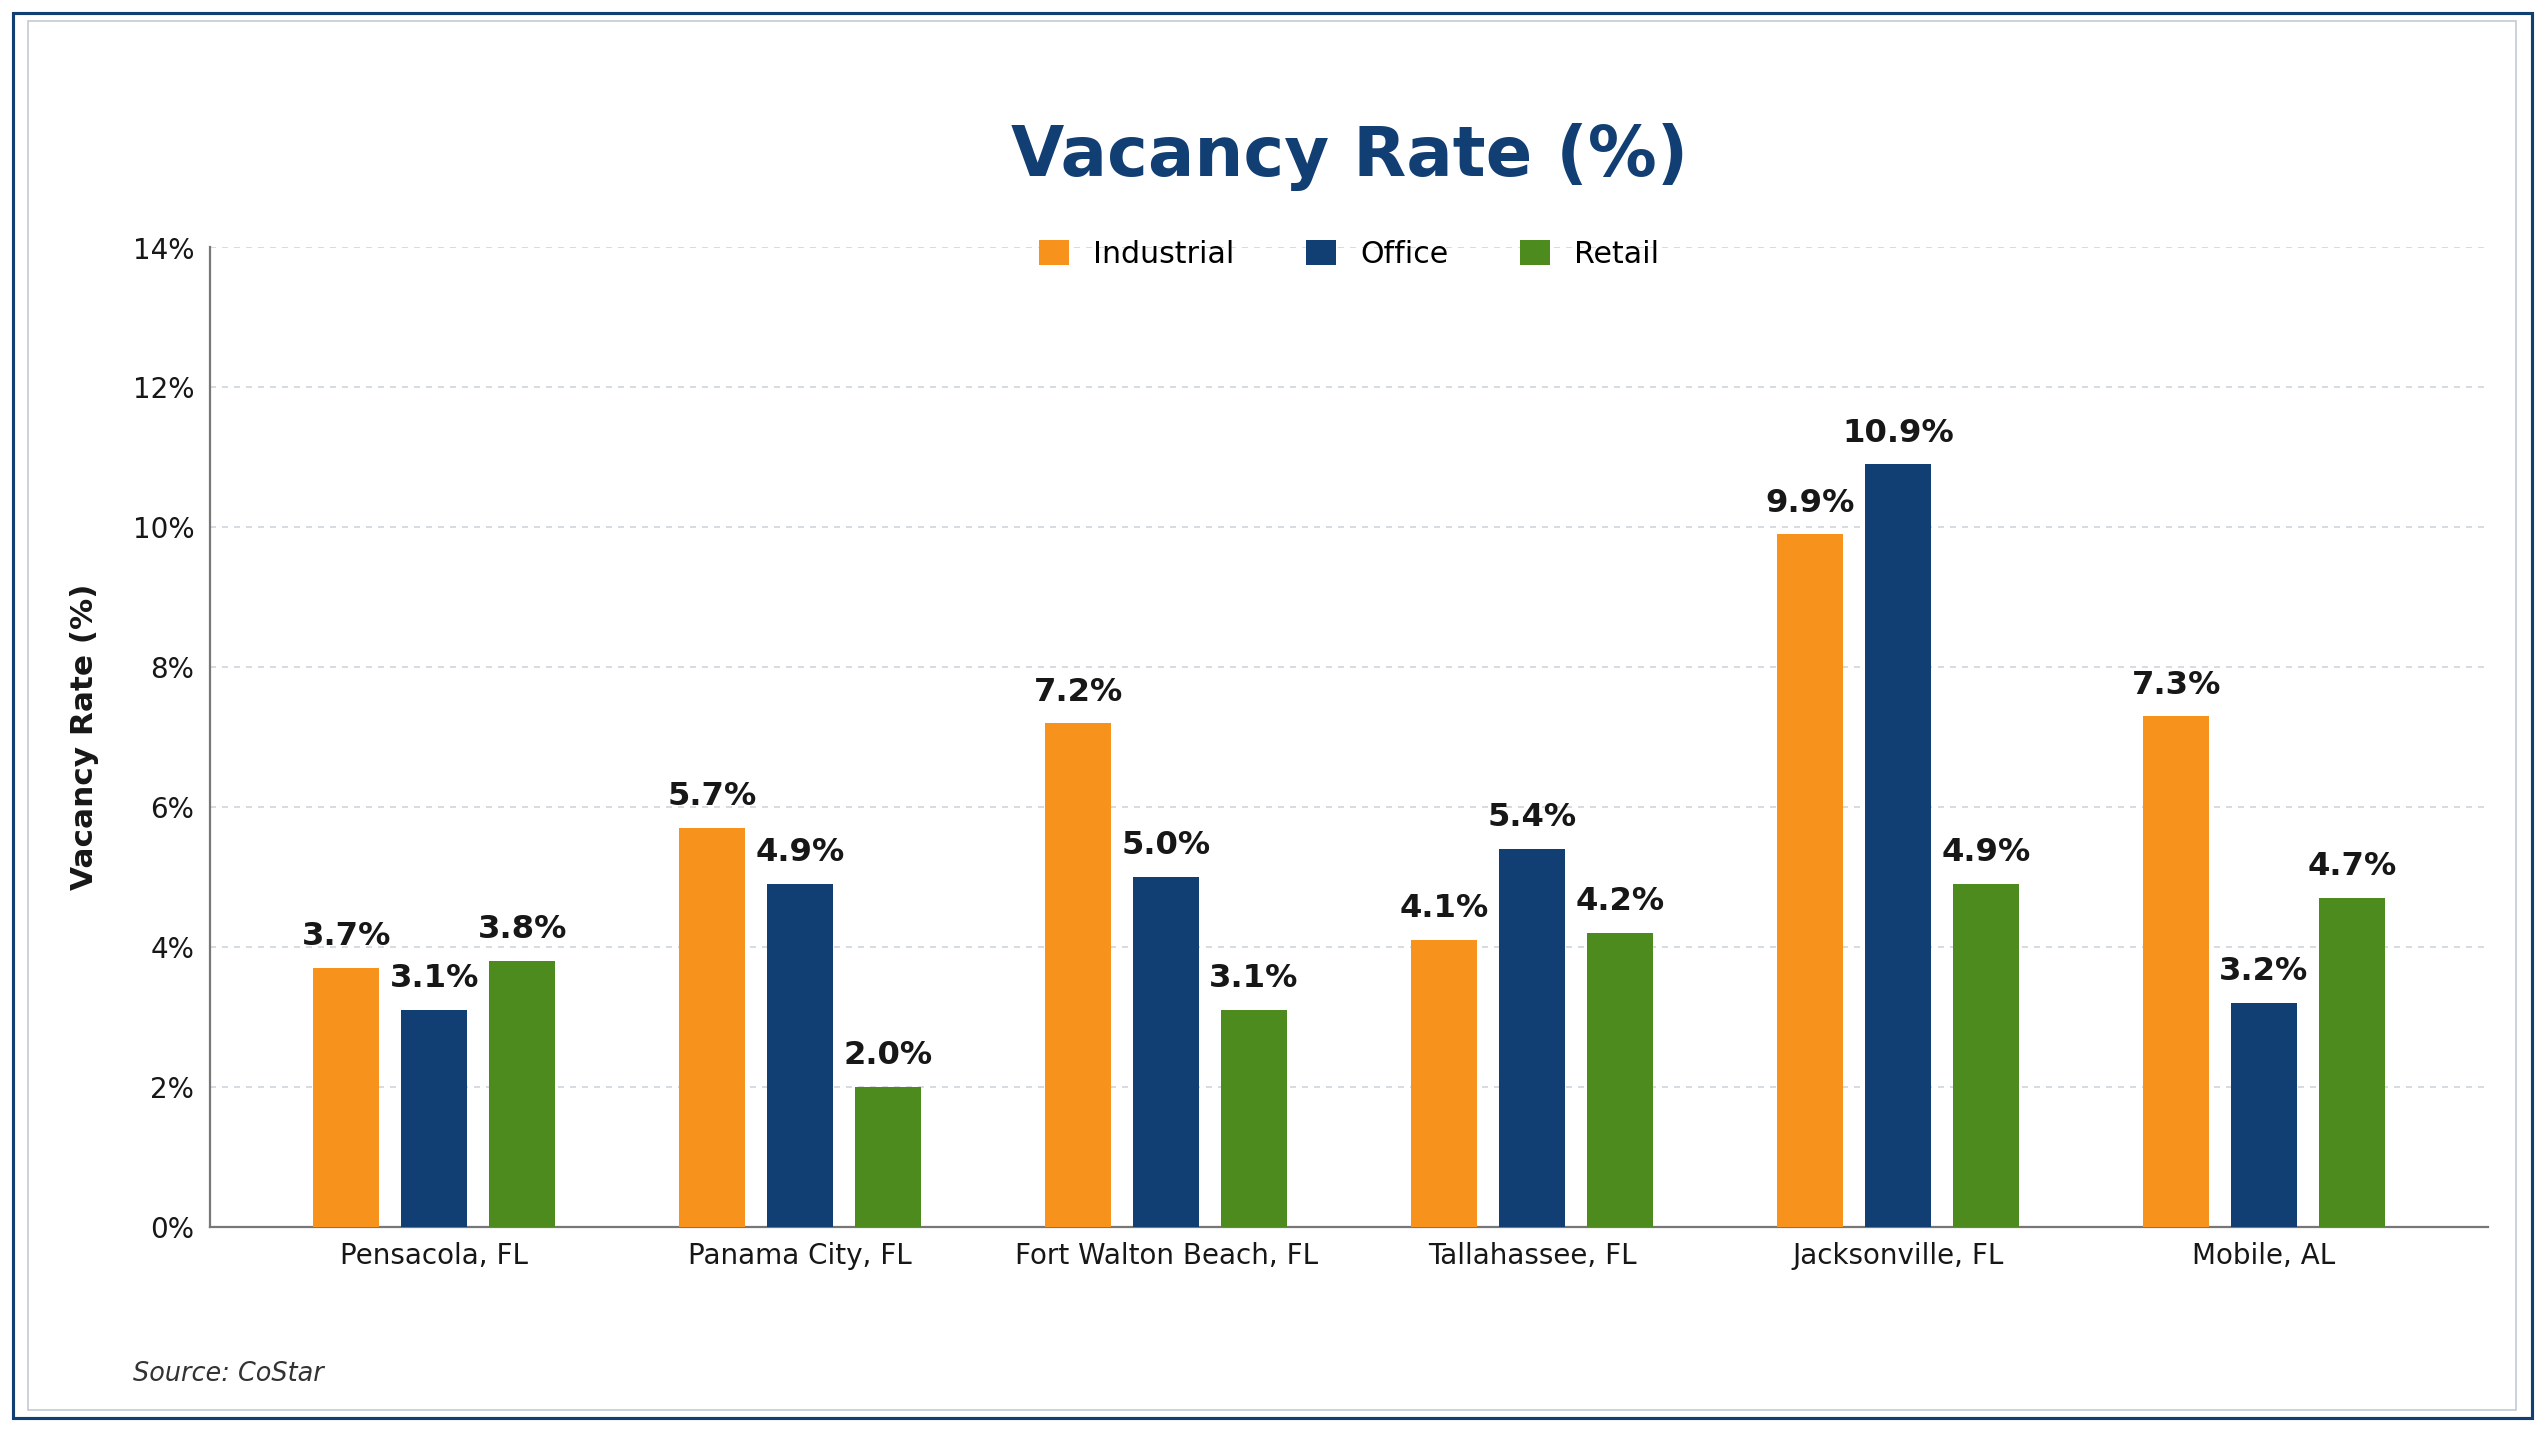
- Jacksonville shows the highest vacancy across the major property types, with industrial at 9.9% and office at 10.9%. This suggests more available space and potentially greater leasing pressure, particularly for owners of office and industrial assets.
- Industrial vacancy varies considerably by market. Fort Walton Beach is at 7.2%, Mobile at 7.3%, and Jacksonville at 9.9%, compared with 3.7% in Pensacola. For buyers and investors, market-level vacancy should be considered alongside property-specific occupancy, lease rollover, and tenant quality.
- Retail vacancy remains comparatively low in most markets, ranging from 2.0% in Panama City to 4.9% in Jacksonville. Lower available space can be relevant when evaluating retail assets, tenant demand, and leasing risk.
- Office vacancy is notably higher than retail in several markets, including Jacksonville (10.9%), Tallahassee (5.4%), and Fort Walton Beach (5.0%). For owners and sellers, current occupancy and upcoming lease expirations may have a larger impact on buyer underwriting in these markets.
Market Asking Rent
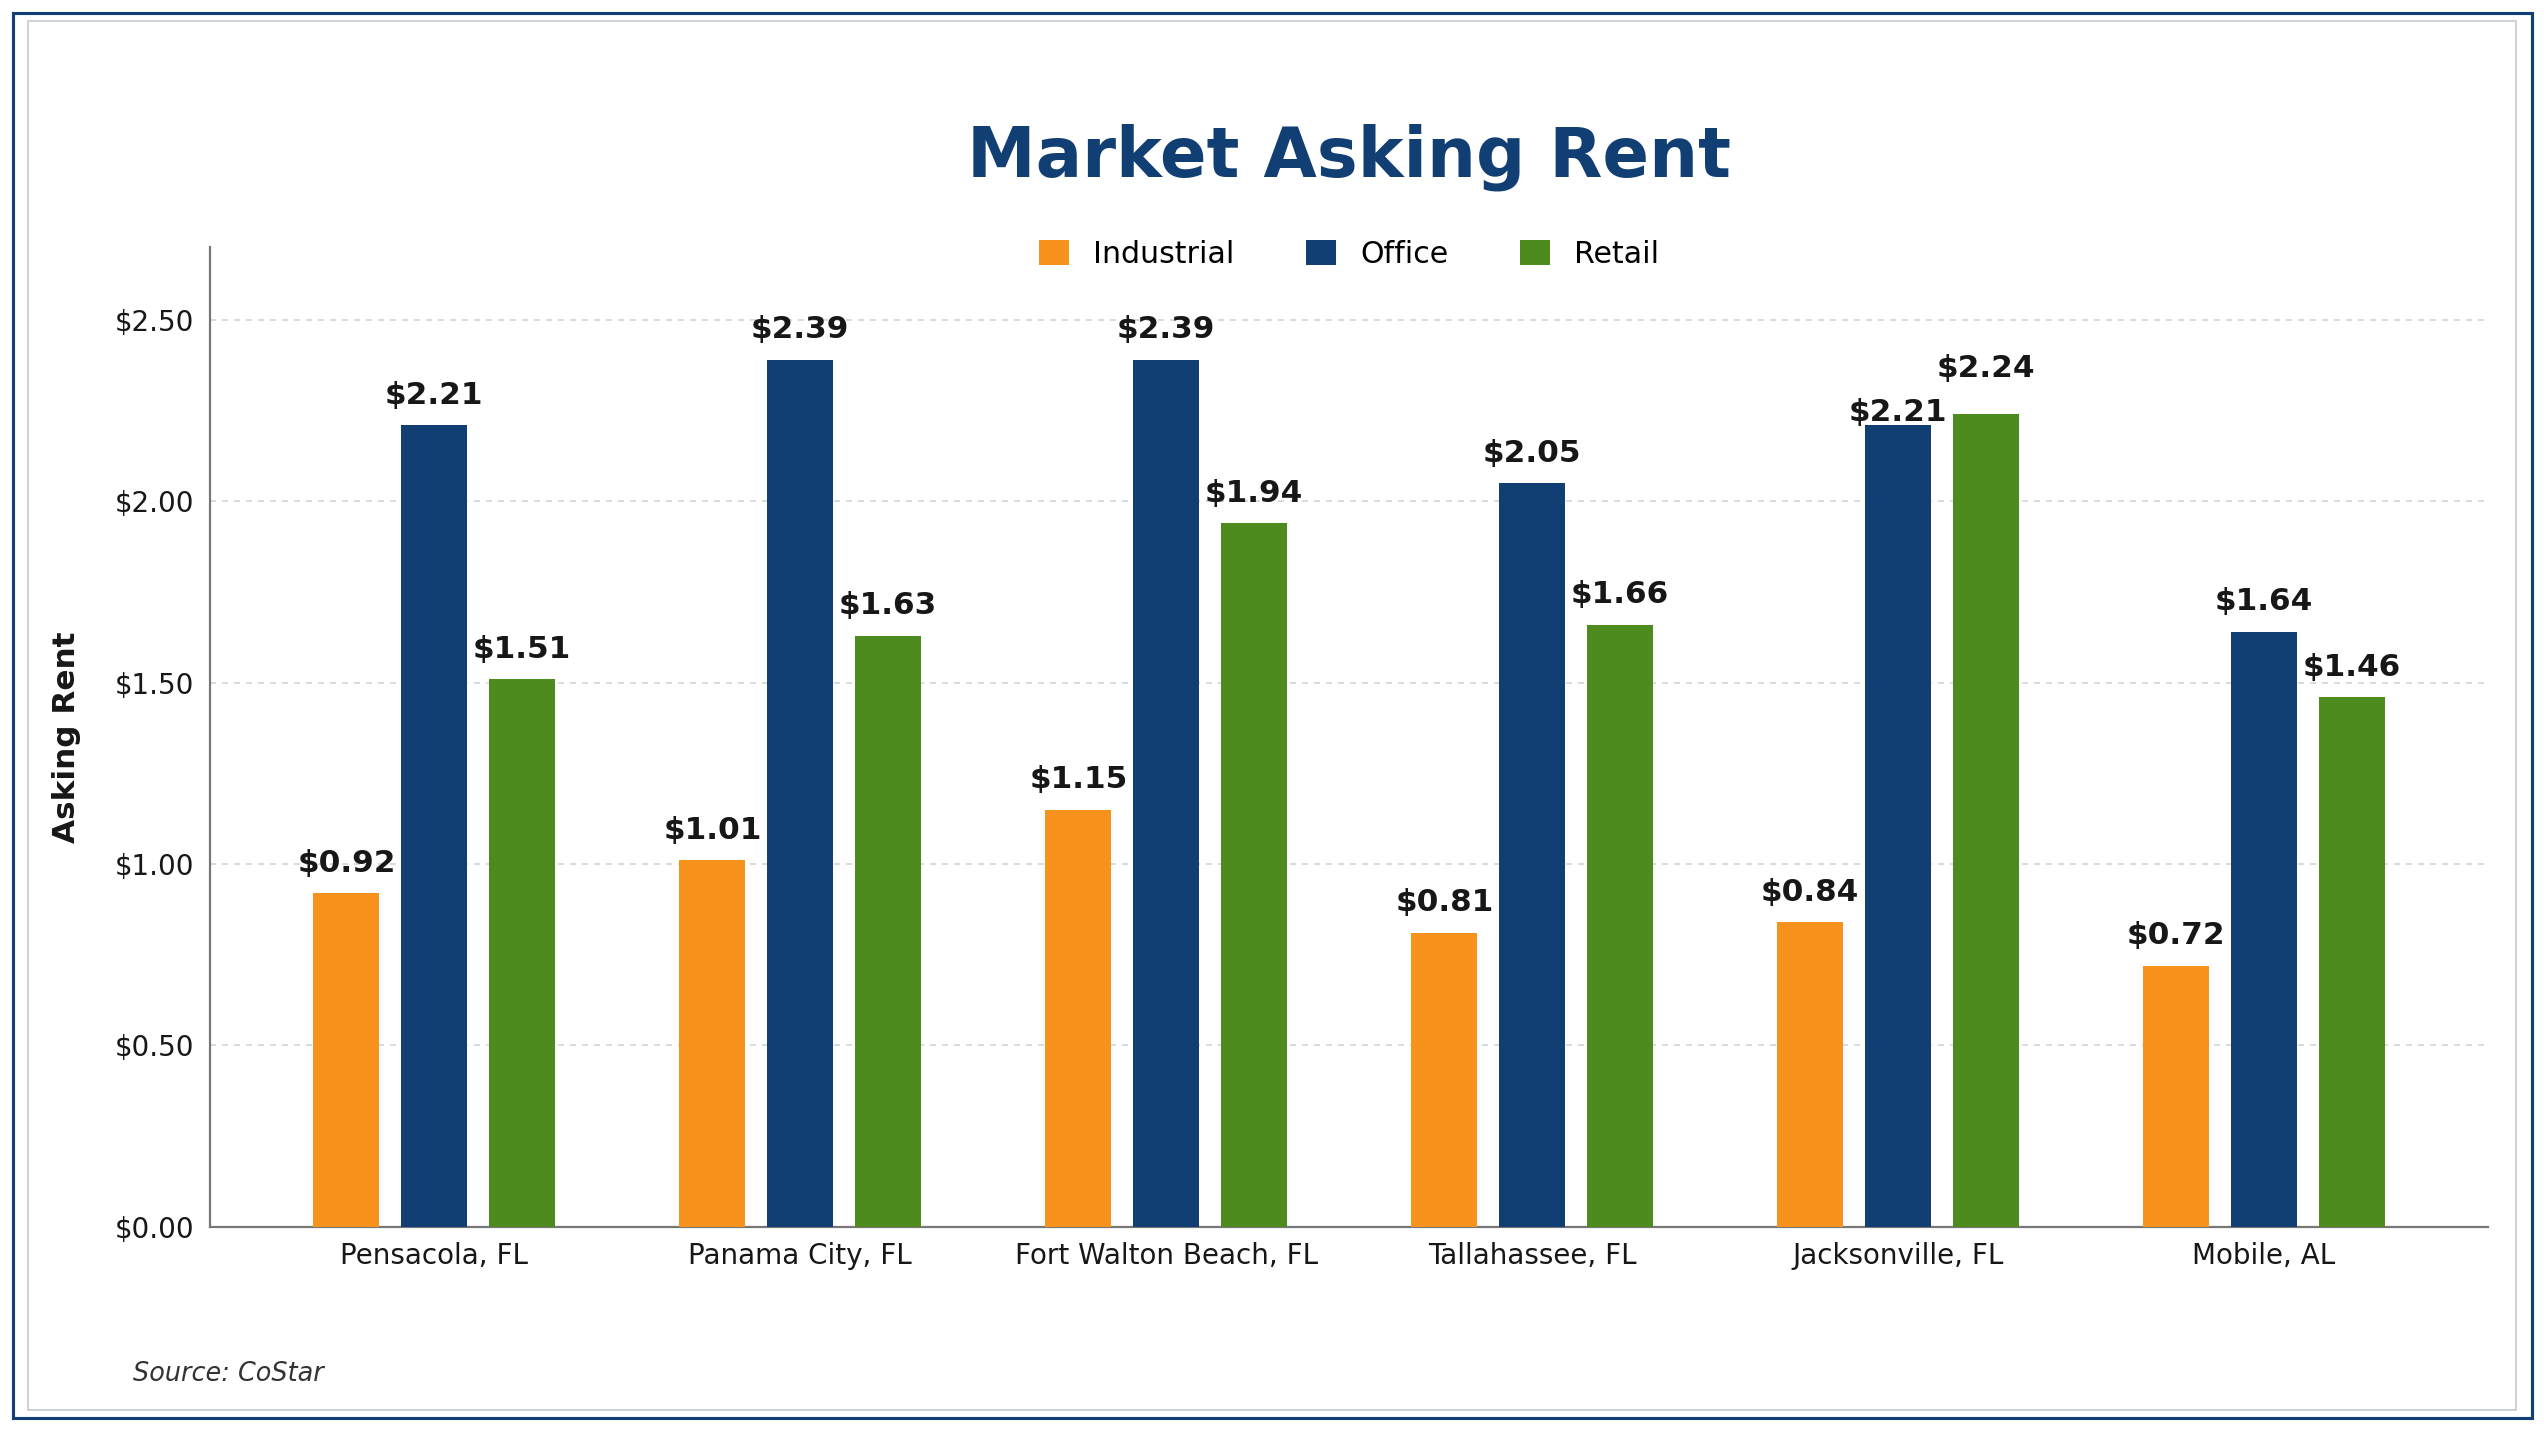
- Office commands the highest asking rent in five of the six markets. Panama City and Fort Walton Beach both reach $2.39/SF, while Pensacola is $2.21/SF and Tallahassee $2.05/SF. Jacksonville is the exception, where retail asking rent ($2.24/SF) slightly exceeds office ($2.21/SF).
- Industrial remains the lowest-priced sector across every market, ranging from $0.72/SF in Mobile to $1.15/SF in Fort Walton Beach. For buyers and investors, this creates a meaningful rent differential versus office and retail, but property-level expenses and tenant quality still need to be evaluated alongside asking rents.
- Fort Walton Beach shows relatively strong asking rents across all three property types, with industrial at $1.15/SF, office at $2.39/SF, and retail at $1.94/SF. That spread may be relevant when comparing asset types within the same market.
- Jacksonville has the narrowest gap between office and retail asking rents, at just $0.03/SF, while Mobile has the lowest asking rents across all three categories among these six markets. For sellers and buyers, local rent positioning can materially affect income assumptions and valuation.
Availability Rate (%)
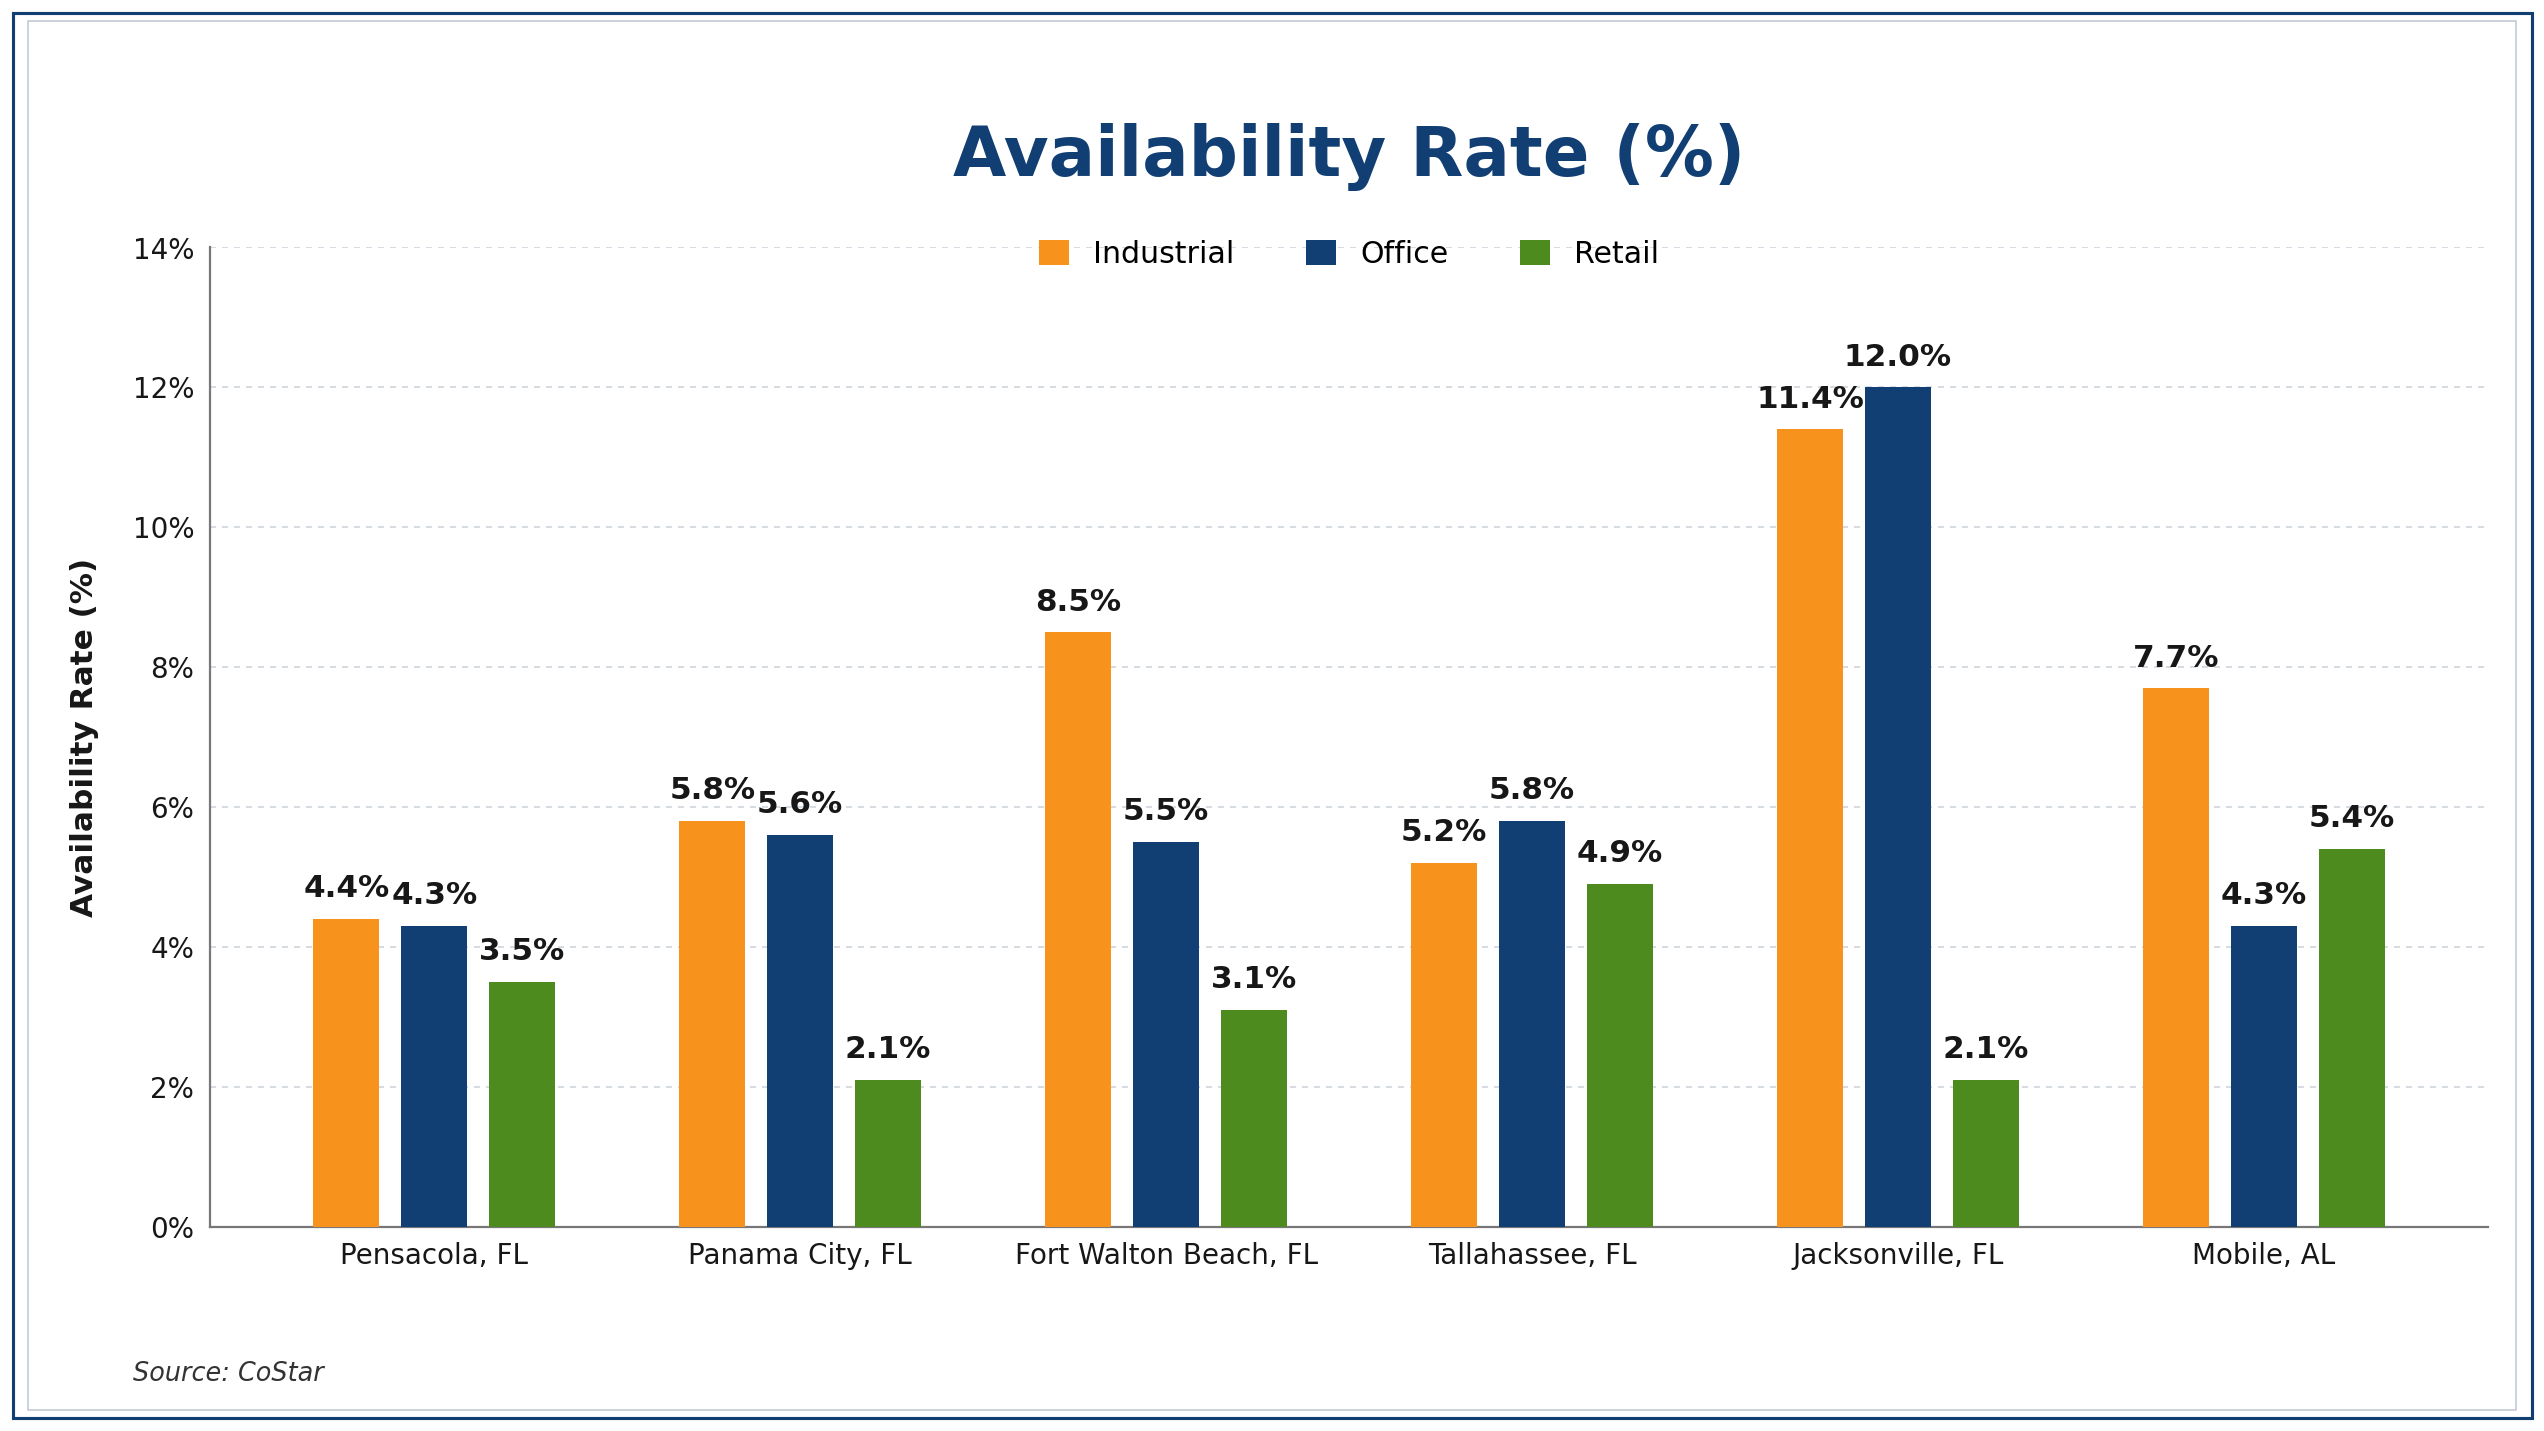
- Jacksonville has the highest availability in the group, with industrial at 11.4% and office at 12.0%. Owners and sellers may need to account for greater leasing competition, while buyers can examine whether pricing reflects the available-space environment.
- Retail availability is only 2.1% in both Panama City and Jacksonville. For owners and sellers, limited available space can be an important factor when evaluating leasing and asset positioning.
- Fort Walton Beach industrial availability is 8.5%, well above its 3.1% retail availability. Buyers and investors comparing sectors should account for these differences when evaluating occupancy and leasing assumptions.
- Pensacola remains relatively balanced, with availability ranging from 3.5% retail to 4.4% industrial. This provides a useful benchmark when comparing local assets across property types.
Net Absorption (SF)
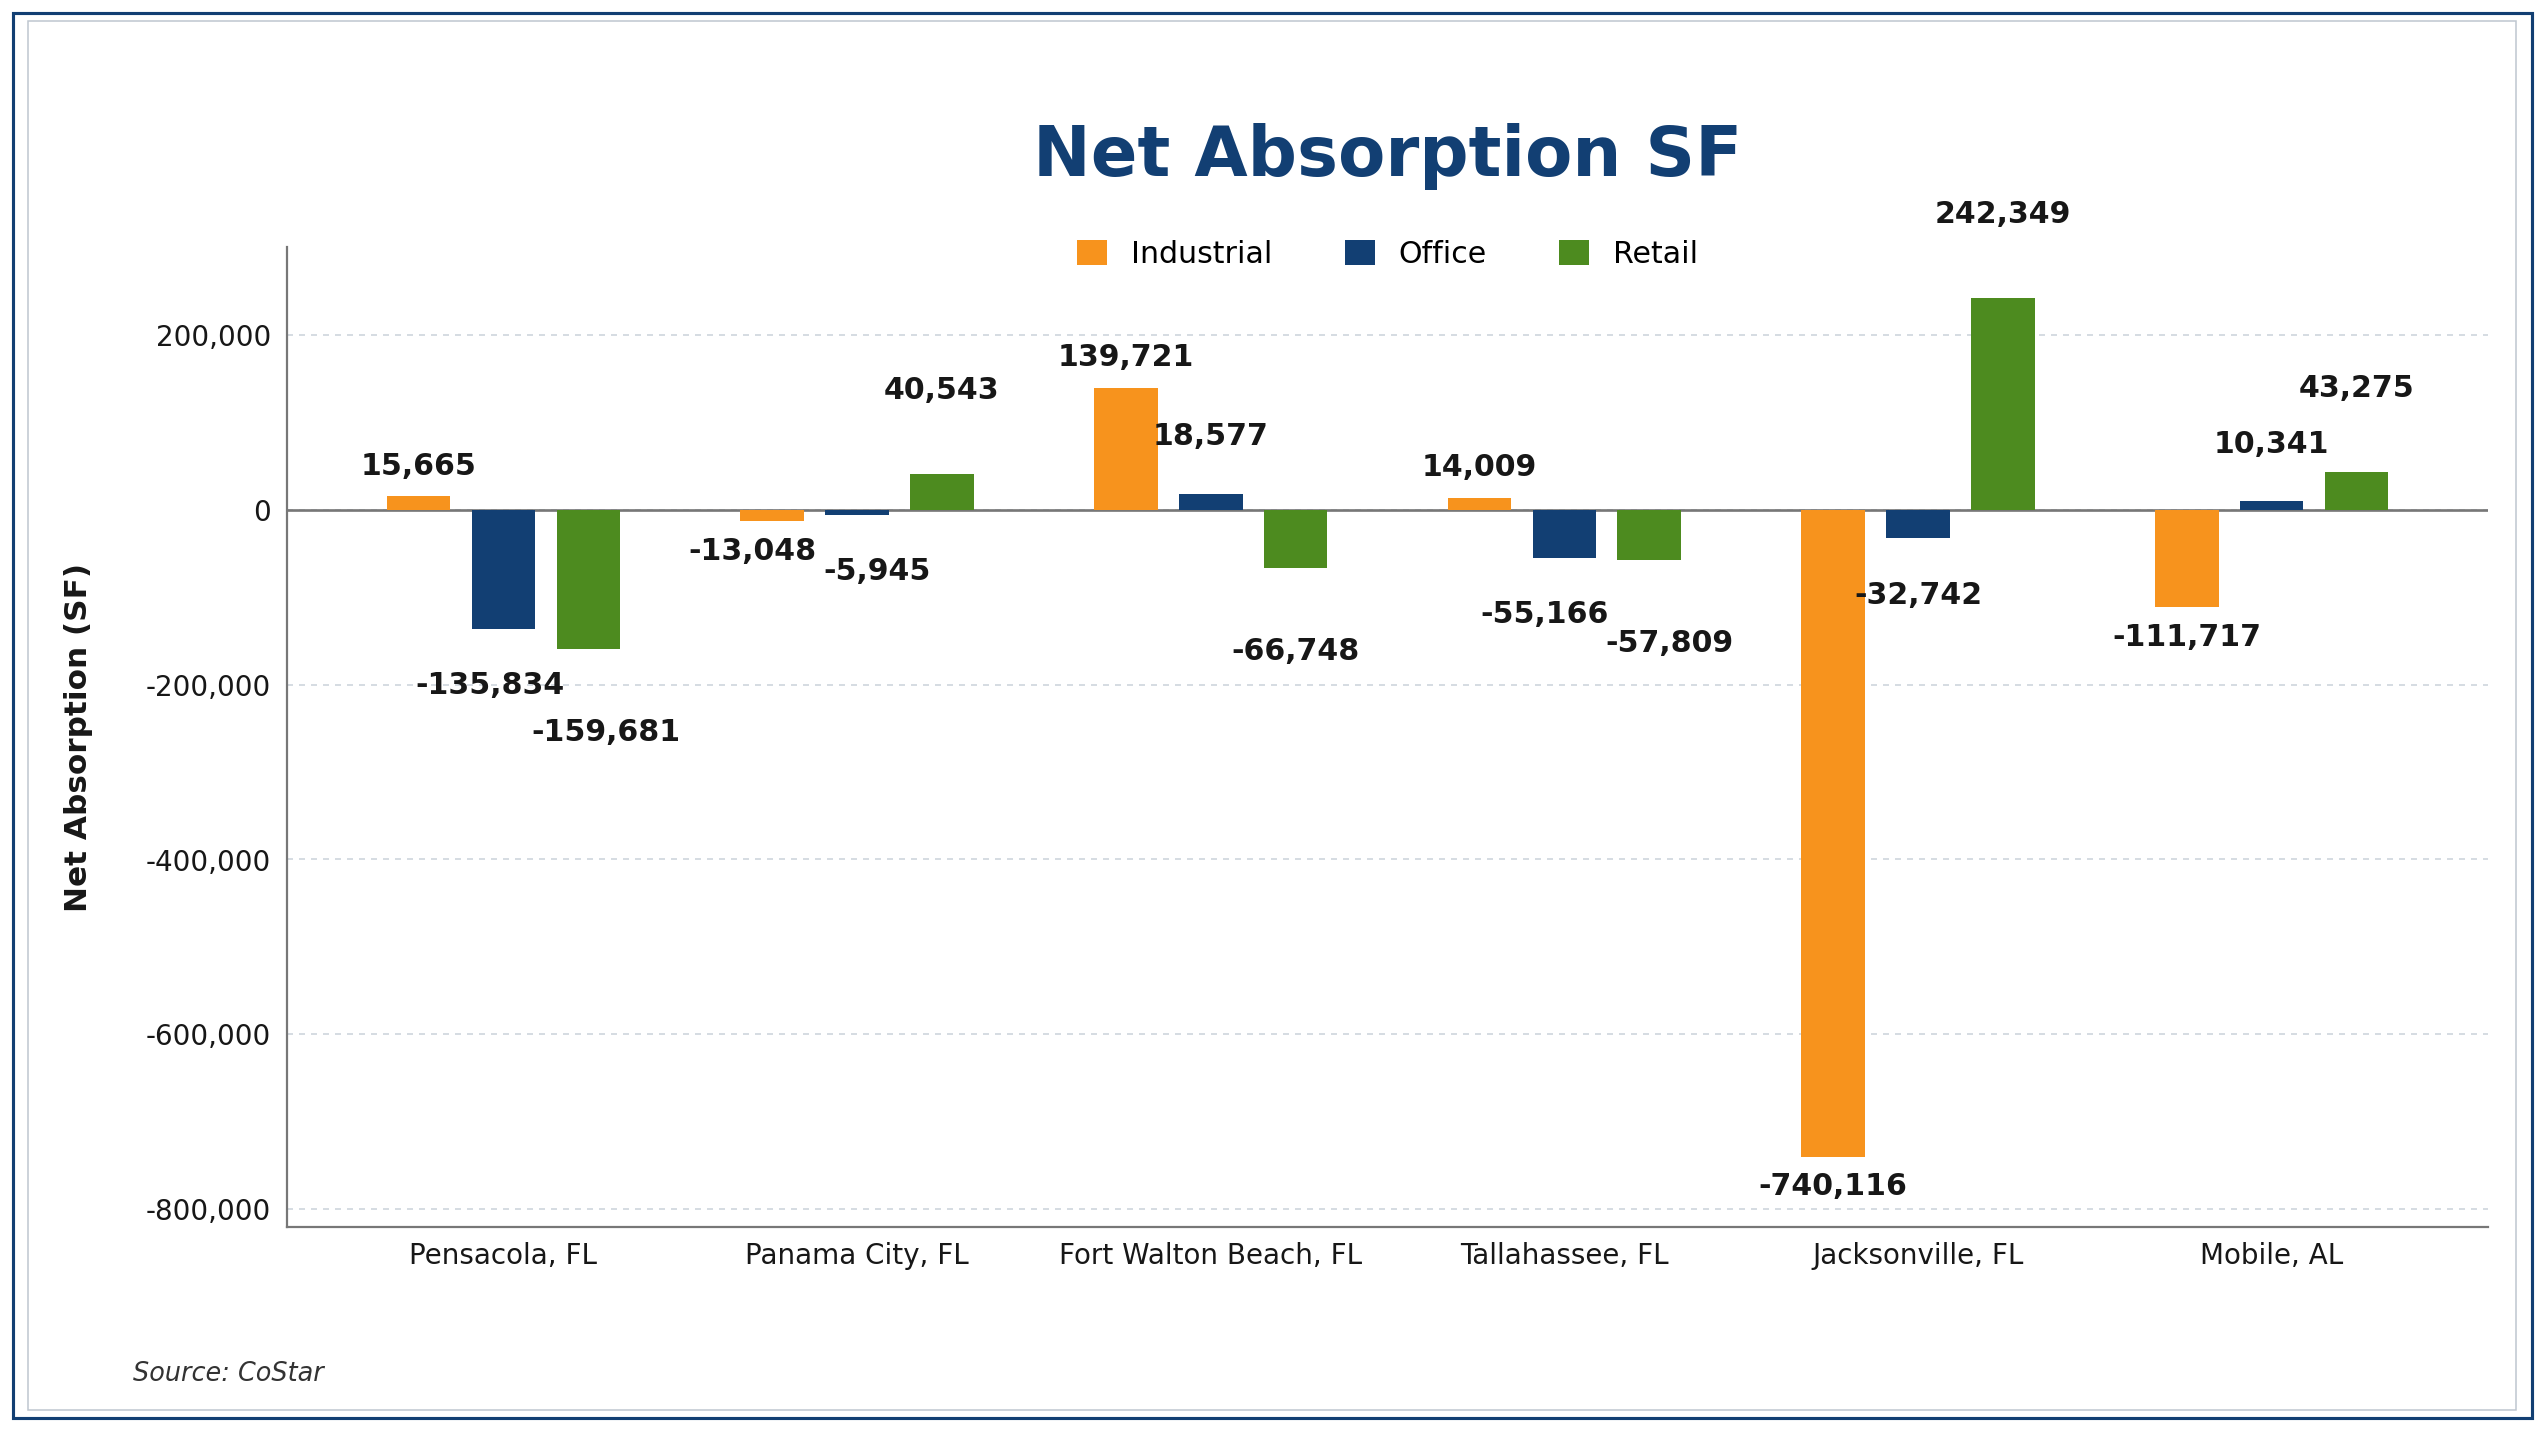
- Jacksonville industrial stands out with -740,116 SF of absorption, while retail gained 242,349 SF. This points to very different demand conditions by property type.
- Fort Walton Beach industrial led positive demand at +139,721 SF, suggesting stronger tenant activity compared with several other markets.
- Retail was positive in Panama City, Jacksonville, and Mobile, which may indicate relatively stronger tenant demand in those markets.
- Pensacola and Tallahassee were negative across all three sectors, suggesting softer leasing conditions and a need for closer property-level underwriting.
Deliveries (SF)
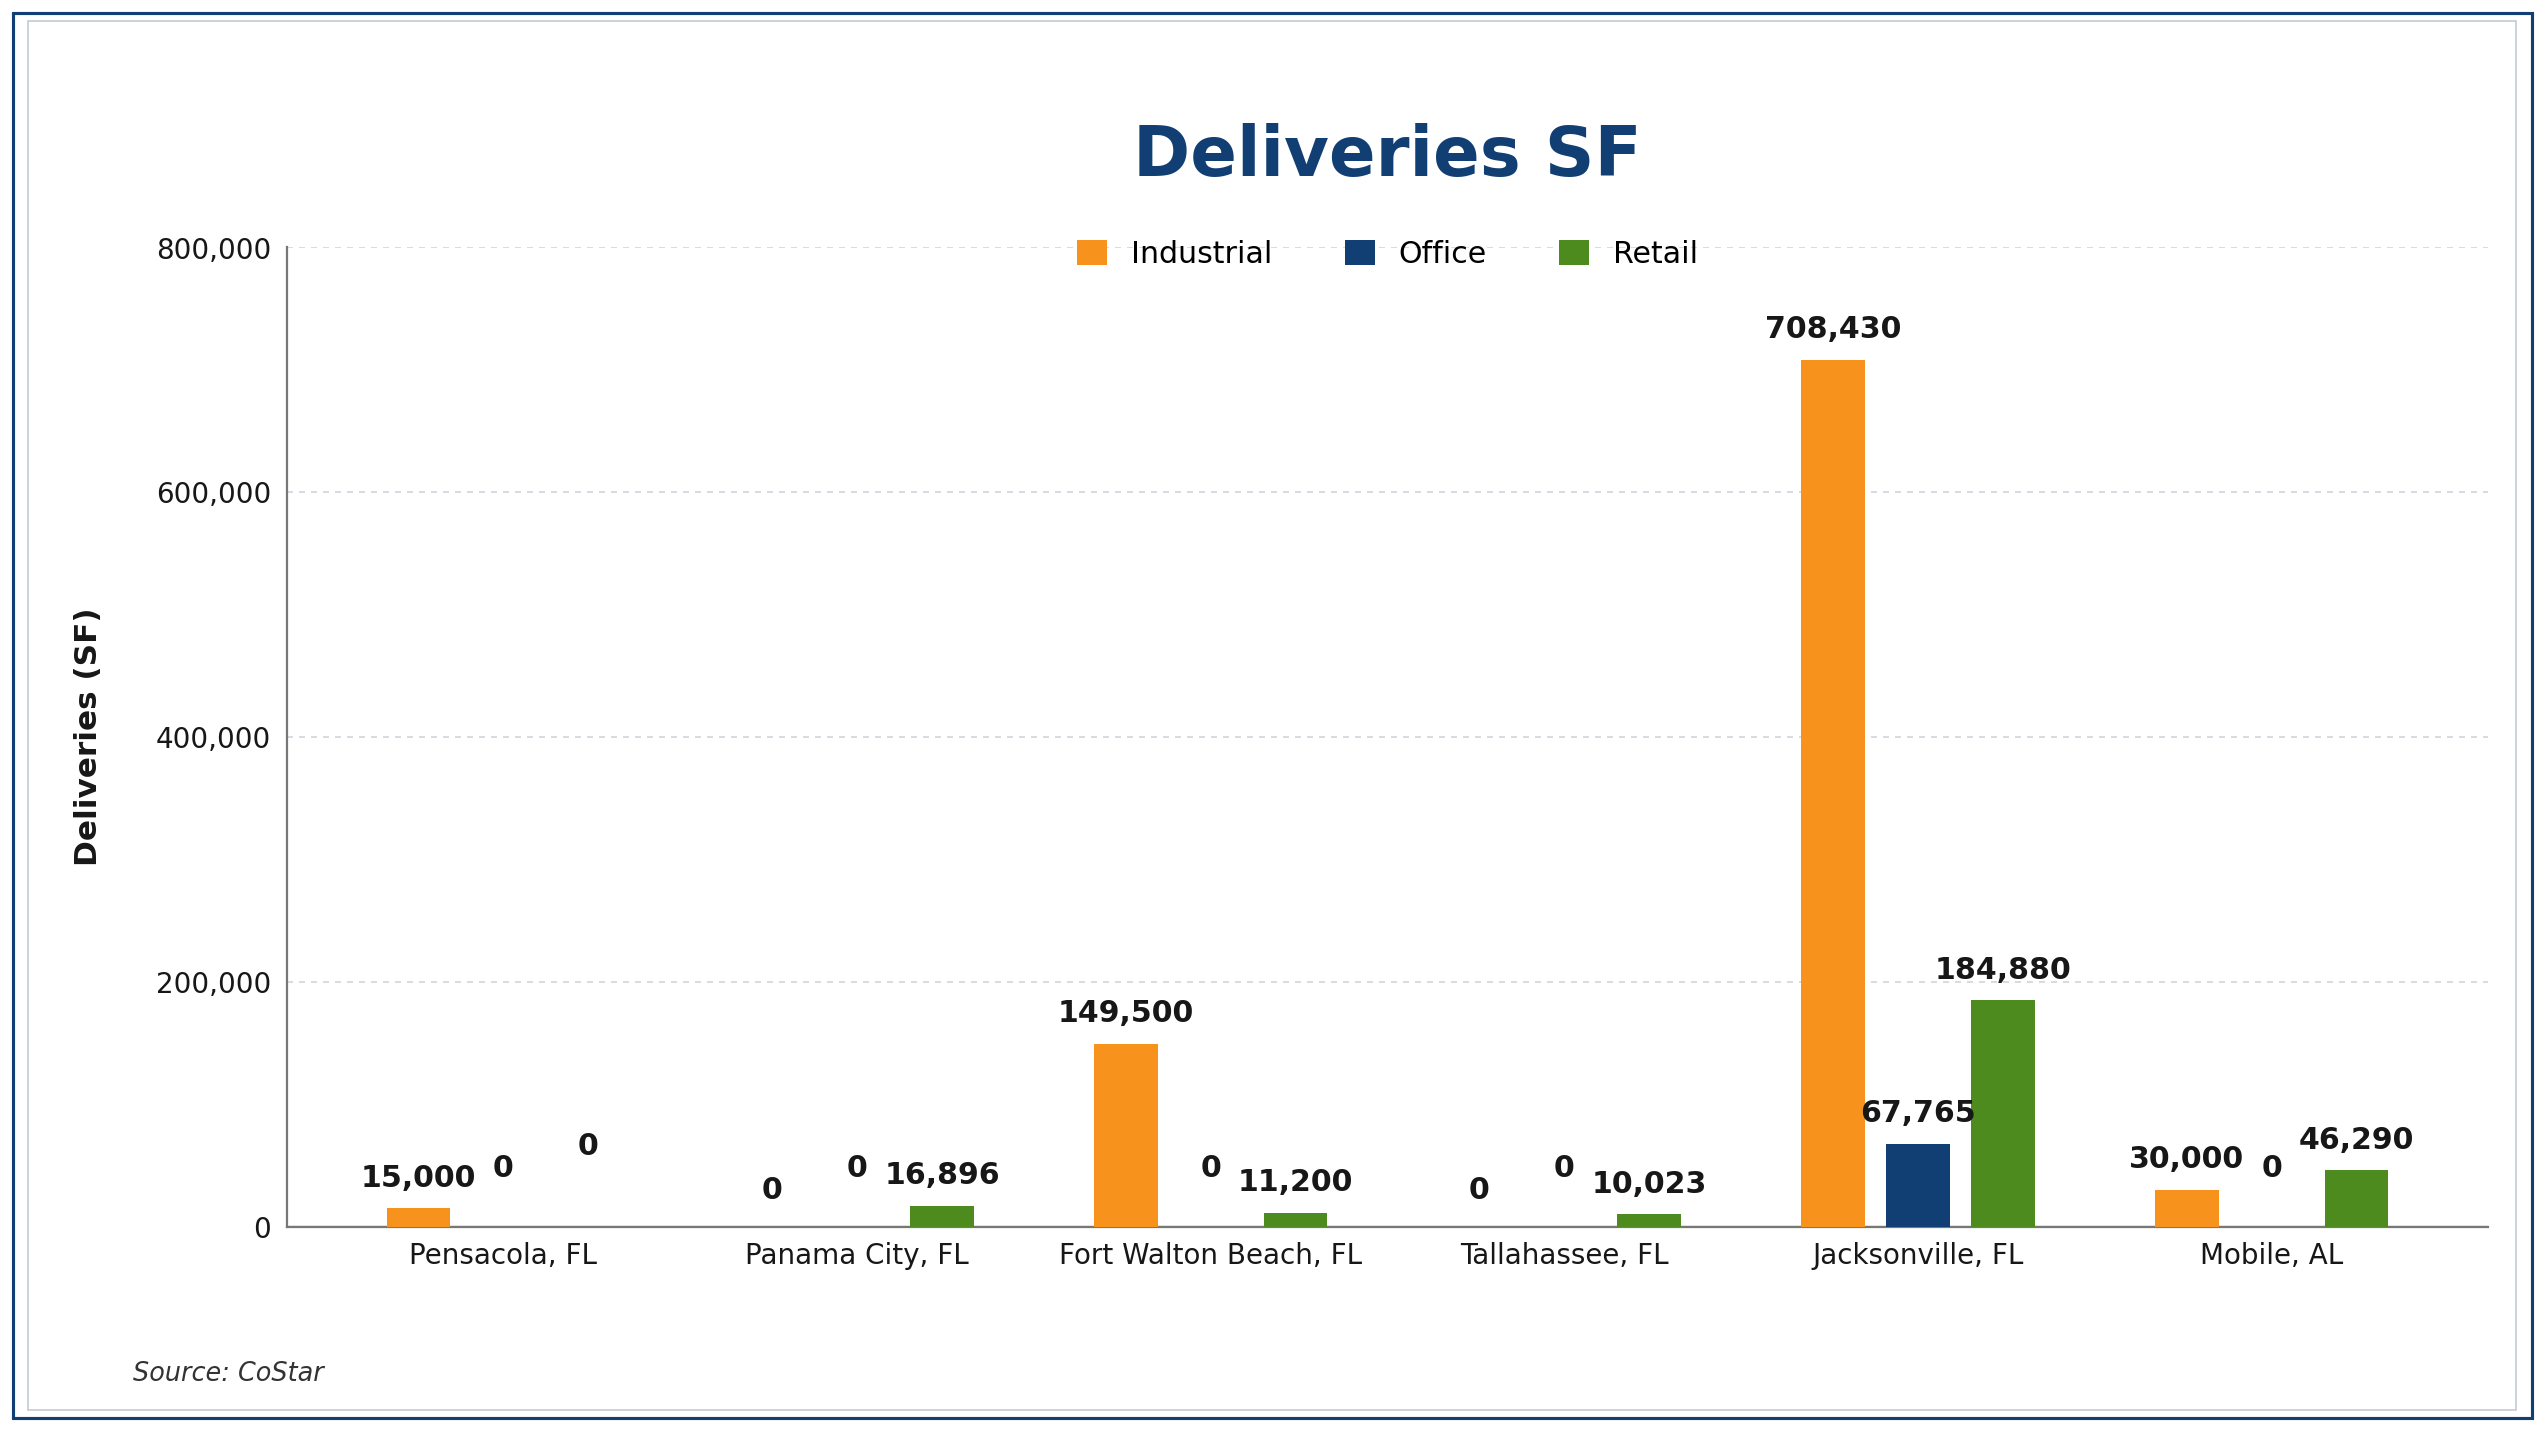
- Jacksonville is absorbing a major share of new supply, with 708,430 SF of industrial and 184,880 SF of retail delivered. This materially increases the amount of space competing for tenants in those sectors.
- Industrial deliveries are concentrated in Jacksonville and Fort Walton Beach, at 708,430 SF and 149,500 SF, respectively. This suggests these markets are seeing the most significant expansion of industrial inventory.
- Most markets had limited new office supply, with 67,765 SF delivered in Jacksonville and none in Pensacola, Panama City, Fort Walton Beach, or Tallahassee. This limits near-term additions to office inventory in those markets.
- For owners and investors, the key issue is supply relative to demand. Markets receiving substantial new inventory warrant closer attention to vacancy, absorption, and lease-up performance to determine whether the added supply is being absorbed efficiently.
Under Construction (SF)
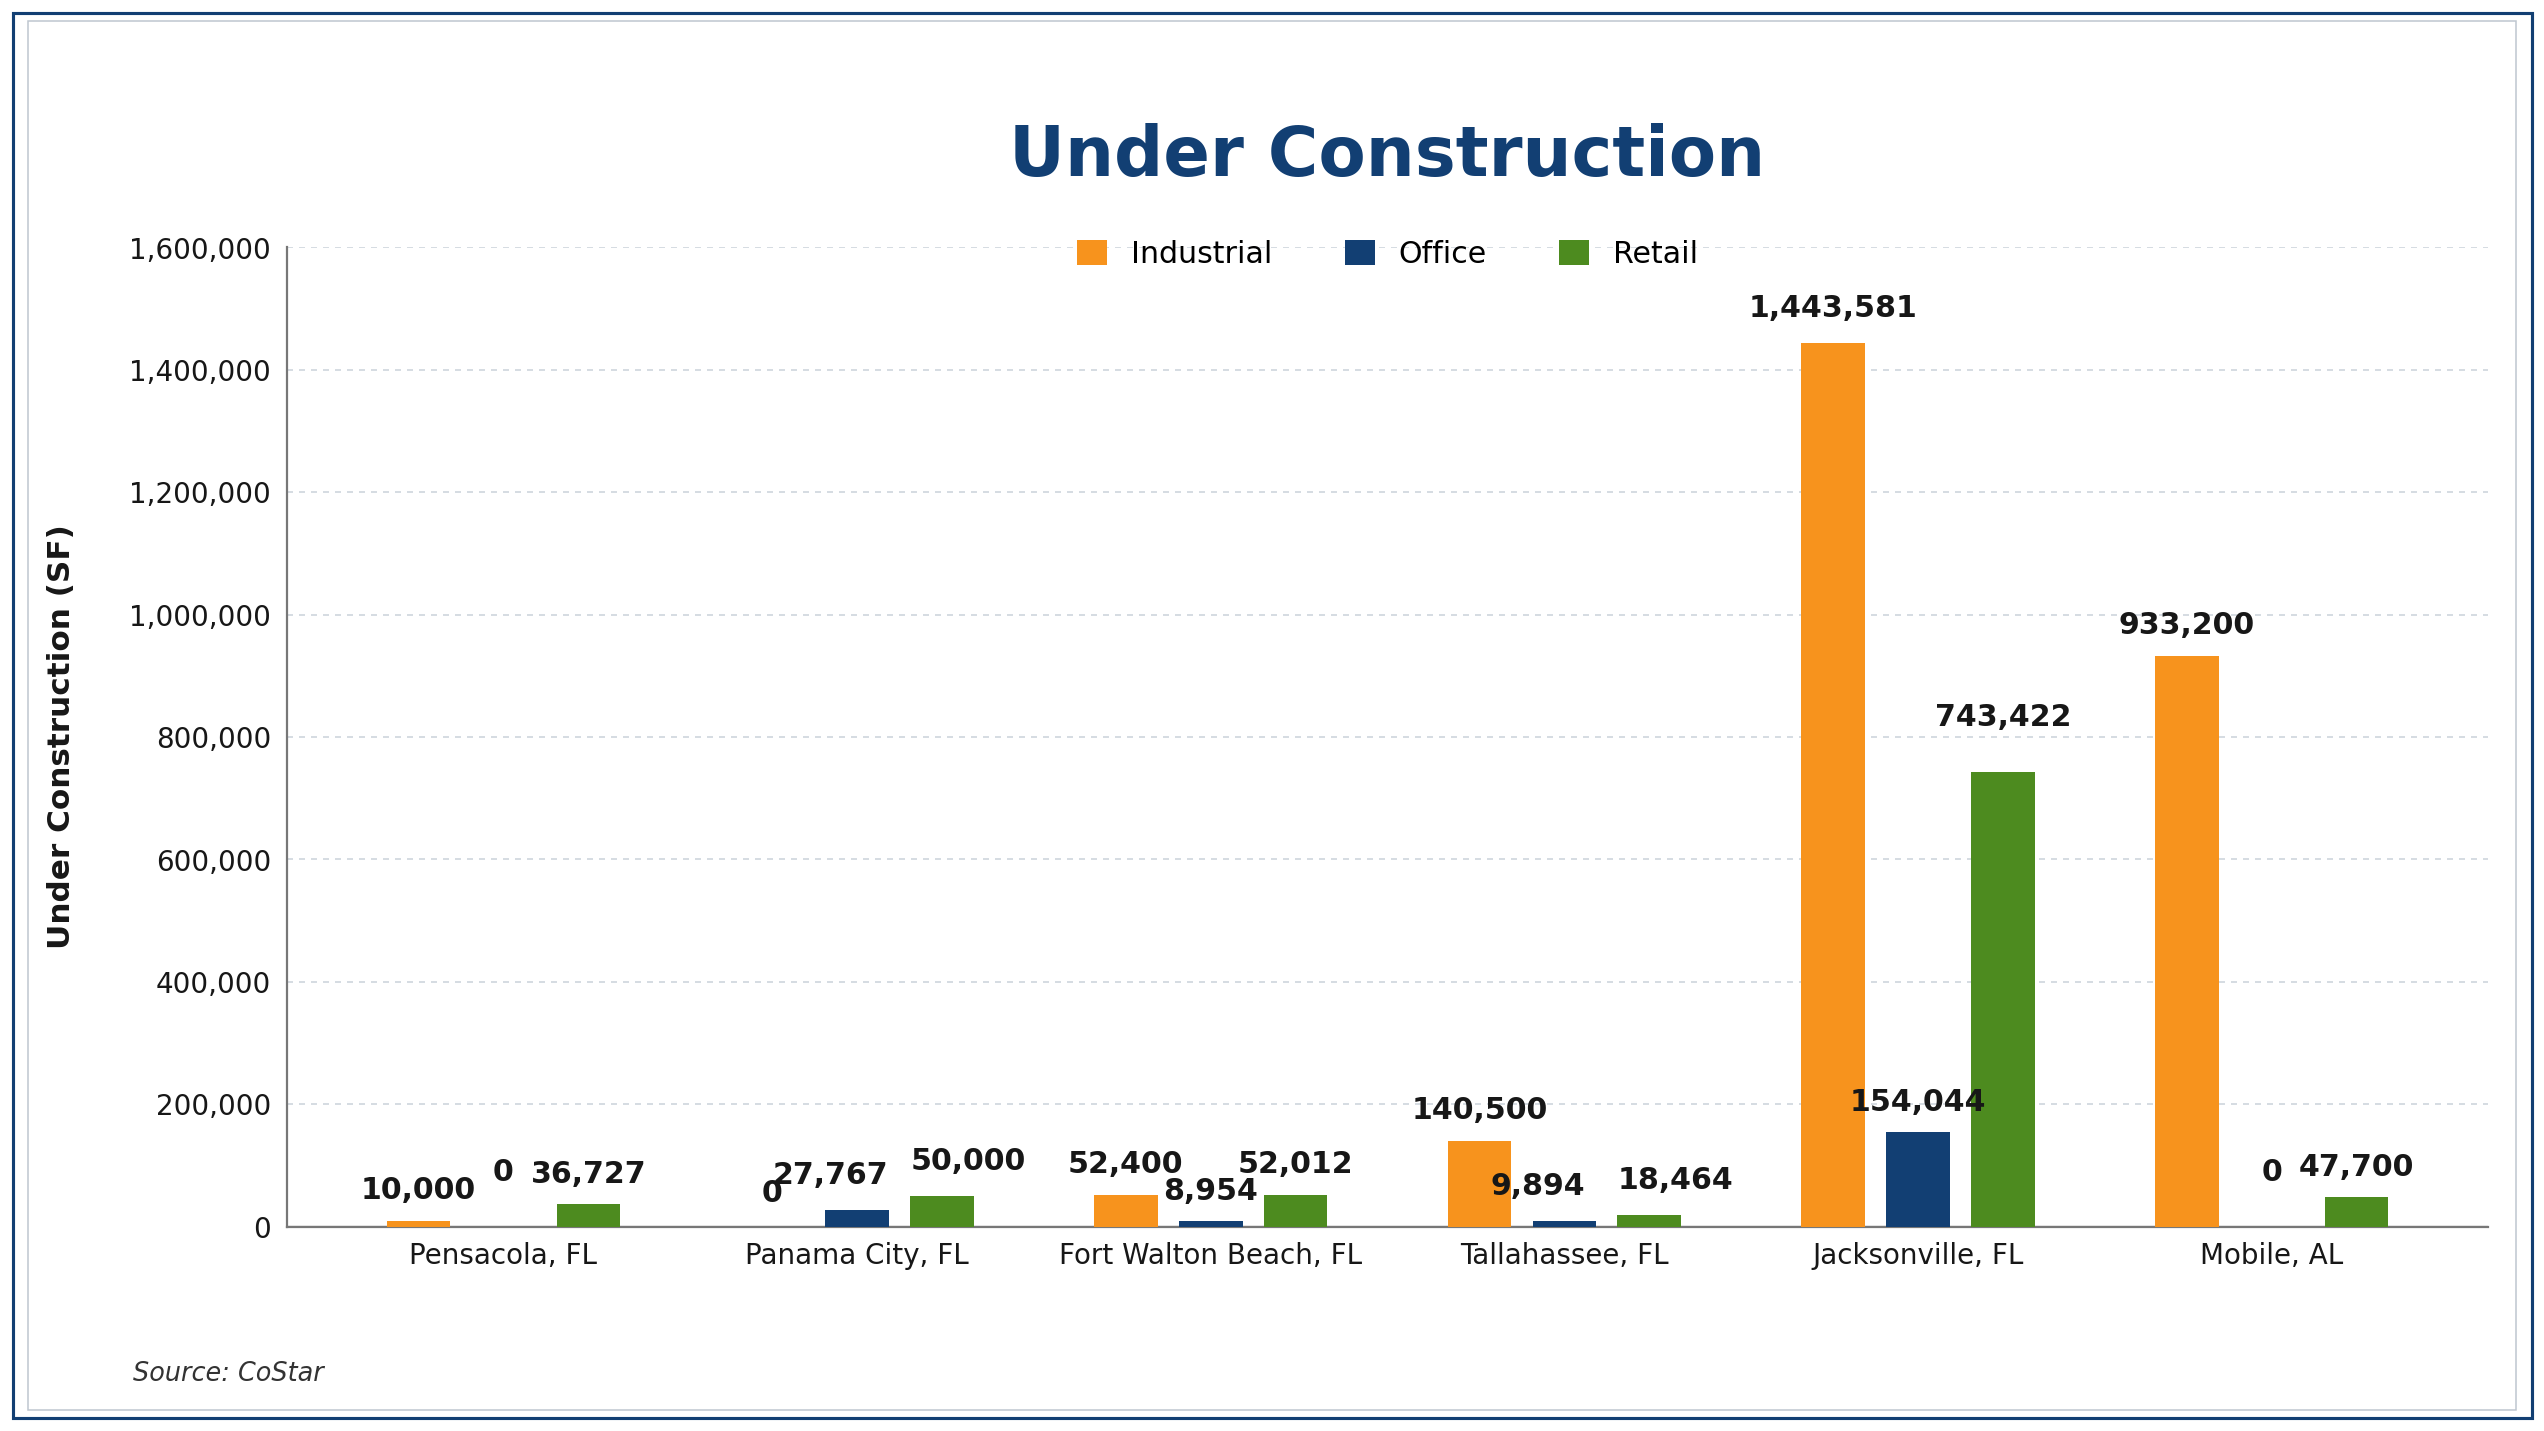
- Jacksonville has the largest construction pipeline by a wide margin, led by 1.44M SF of industrial and 743,422 SF of retail. This puts the market in a much stronger new-supply cycle than the others.
- Mobile also has a significant industrial pipeline at 933,200 SF, which could materially increase future competition among industrial properties as projects deliver.
- Fort Walton Beach and Tallahassee have more moderate pipelines, with 140,500 SF and 52,400 SF of industrial construction, respectively. This suggests less near-term supply pressure than Jacksonville or Mobile.
- For buyers and investors, construction volume should be weighed against current absorption and availability. Markets with large pipelines may offer growth opportunities, but also carry greater lease-up and competitive-supply risk for existing assets.
12 Month Vacancy (YOY)
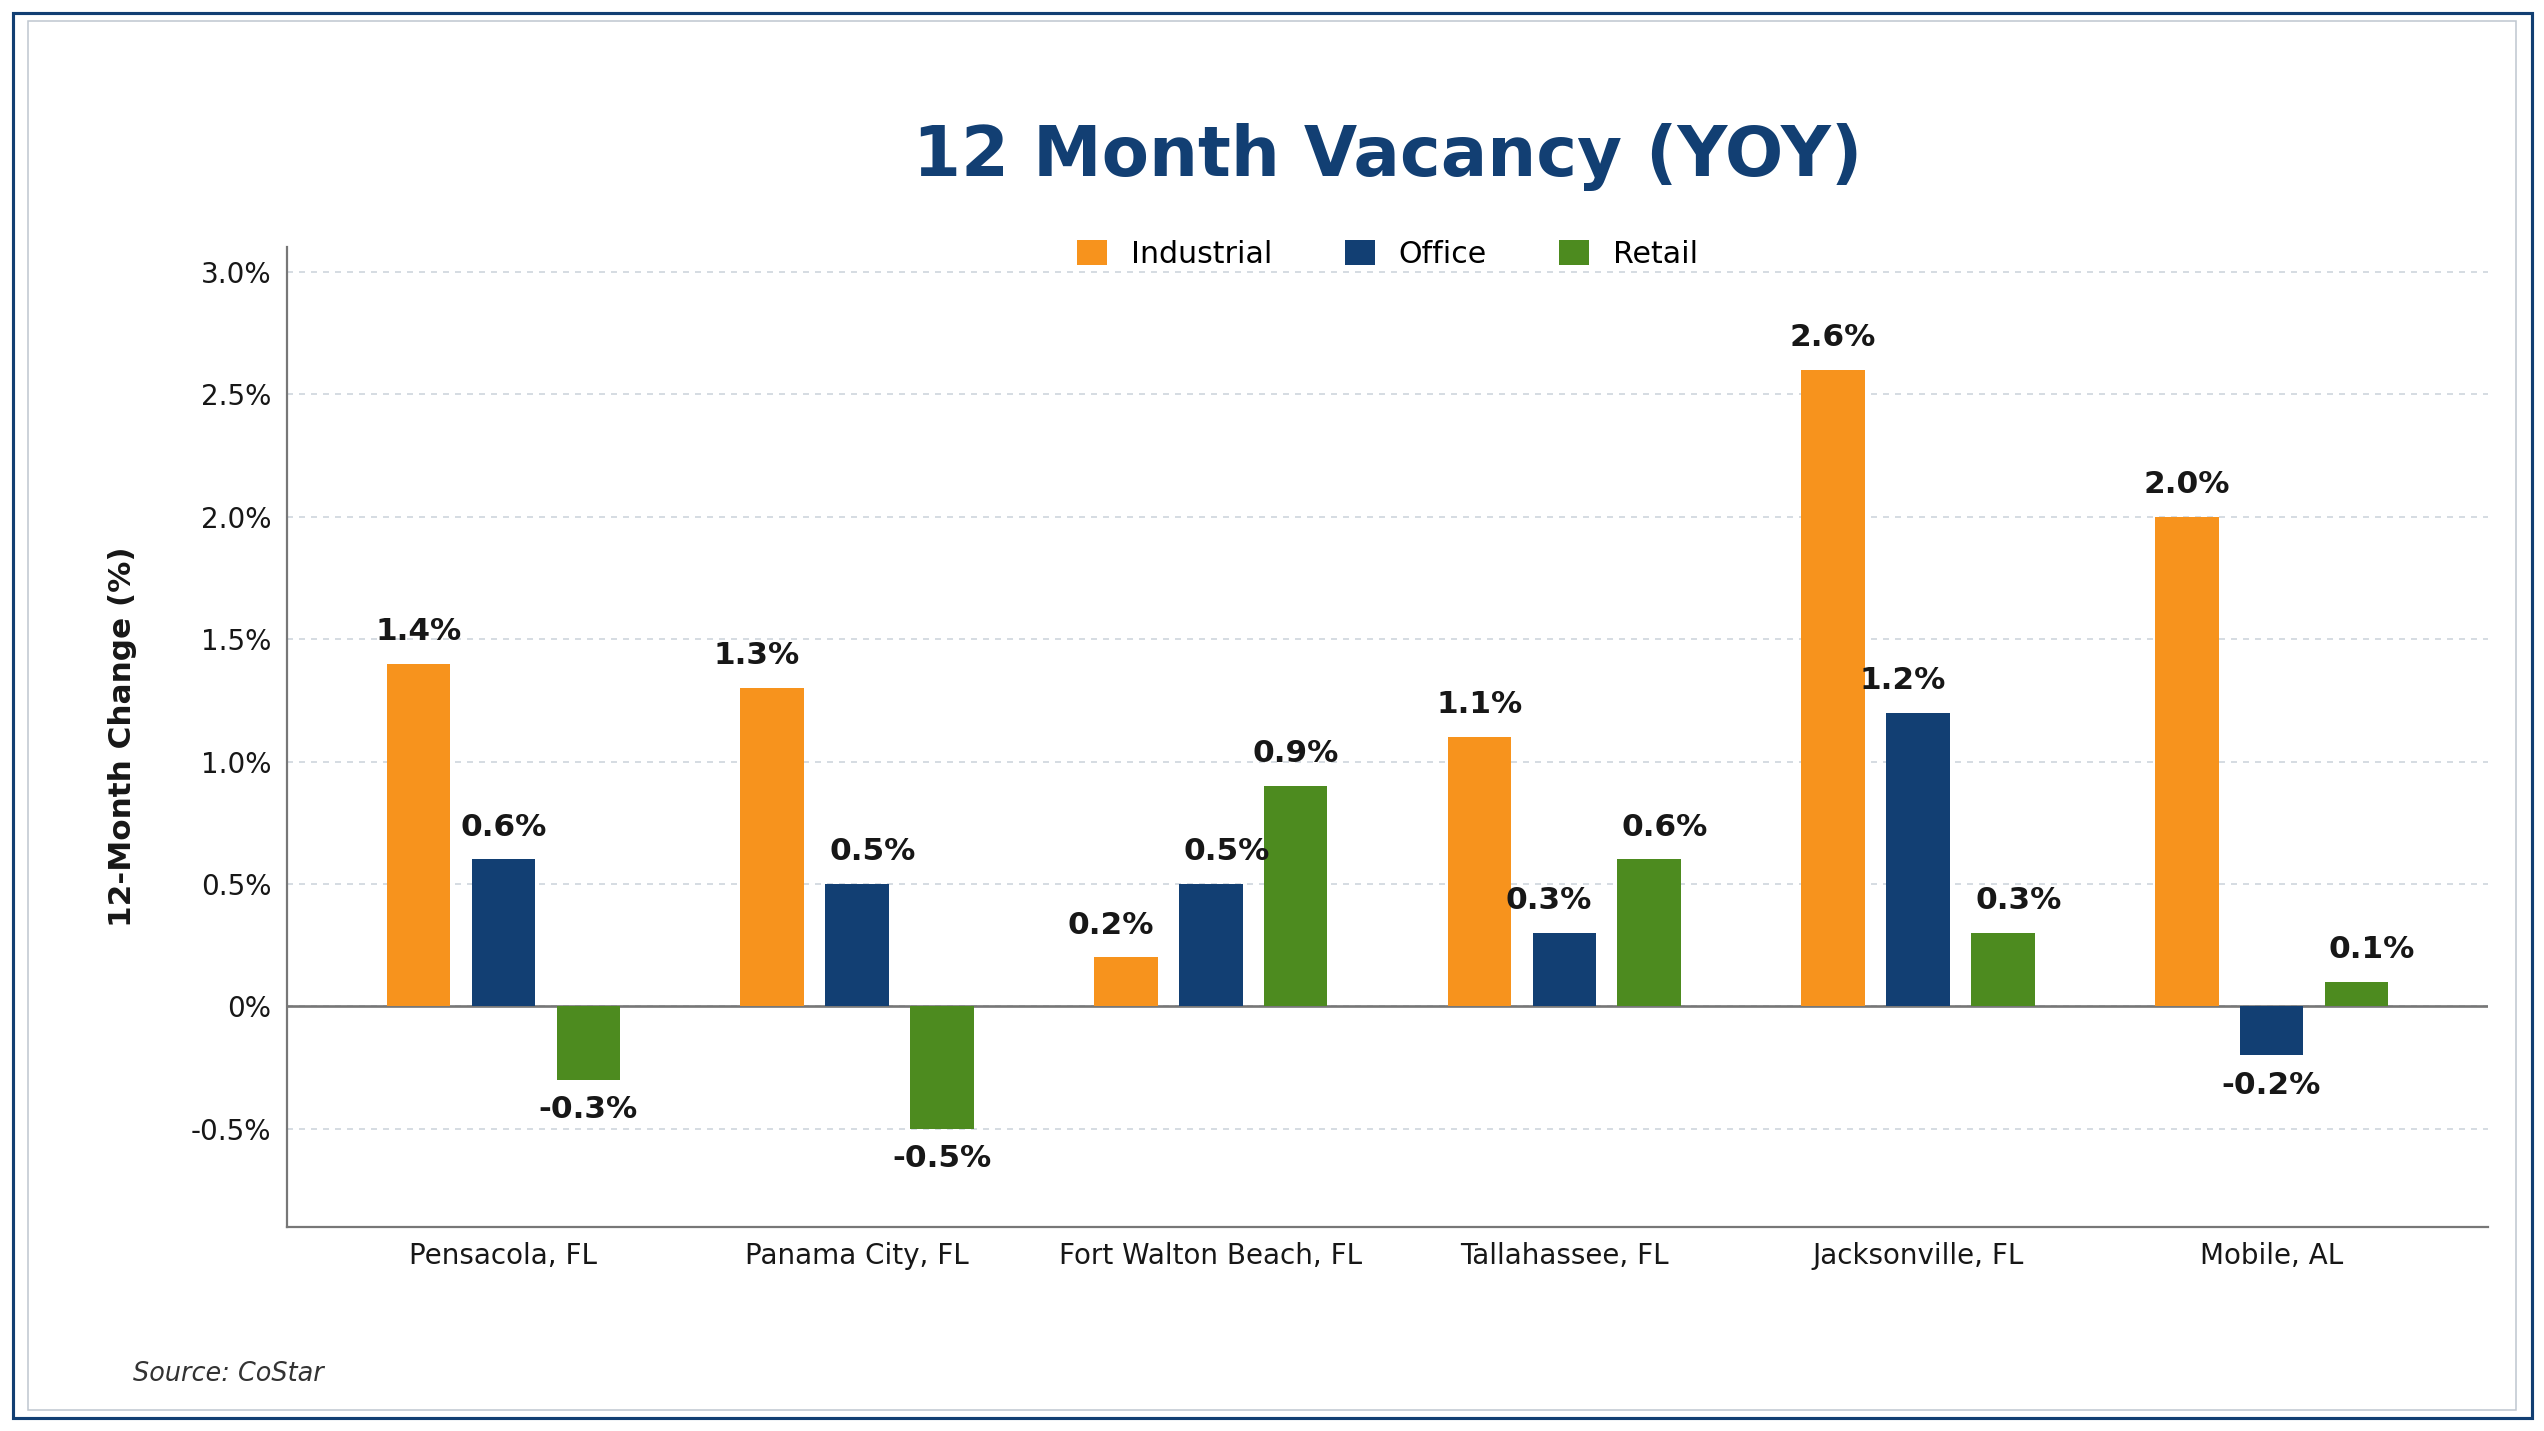
- Industrial is showing the broadest increase in vacancy pressure. Vacancy rose in all six markets, with the largest increases in Jacksonville (+2.6 percentage points), Mobile (+2.0), and Pensacola (+1.4). For owners and sellers, this may translate into greater competition for tenants and more pressure on lease-up strategies and concessions.
- Office conditions are generally softening, but not uniformly. Vacancy increased in Pensacola, Panama City, Fort Walton Beach, Tallahassee, and Jacksonville, with Jacksonville posting the largest increase at +1.2 points. Mobile declined 0.2 points, making it the only market showing an improvement in office vacancy.
- Retail is showing a more localized pattern. Vacancy declined in Pensacola (-0.3) and Panama City (-0.5), while it increased in Fort Walton Beach (+0.9) and Tallahassee (+0.6). This suggests retail conditions are being driven more by individual market dynamics than by a broad regional shift.
- Jacksonville warrants the closest attention because vacancy increased across all three sectors, while its industrial and office markets also carry some of the largest absolute vacancy levels in the broader dataset. For buyers and investors, this makes current occupancy, lease rollover, tenant demand, and the pace of absorption especially important inputs in underwriting.
12 Month Net Absorption (SF)
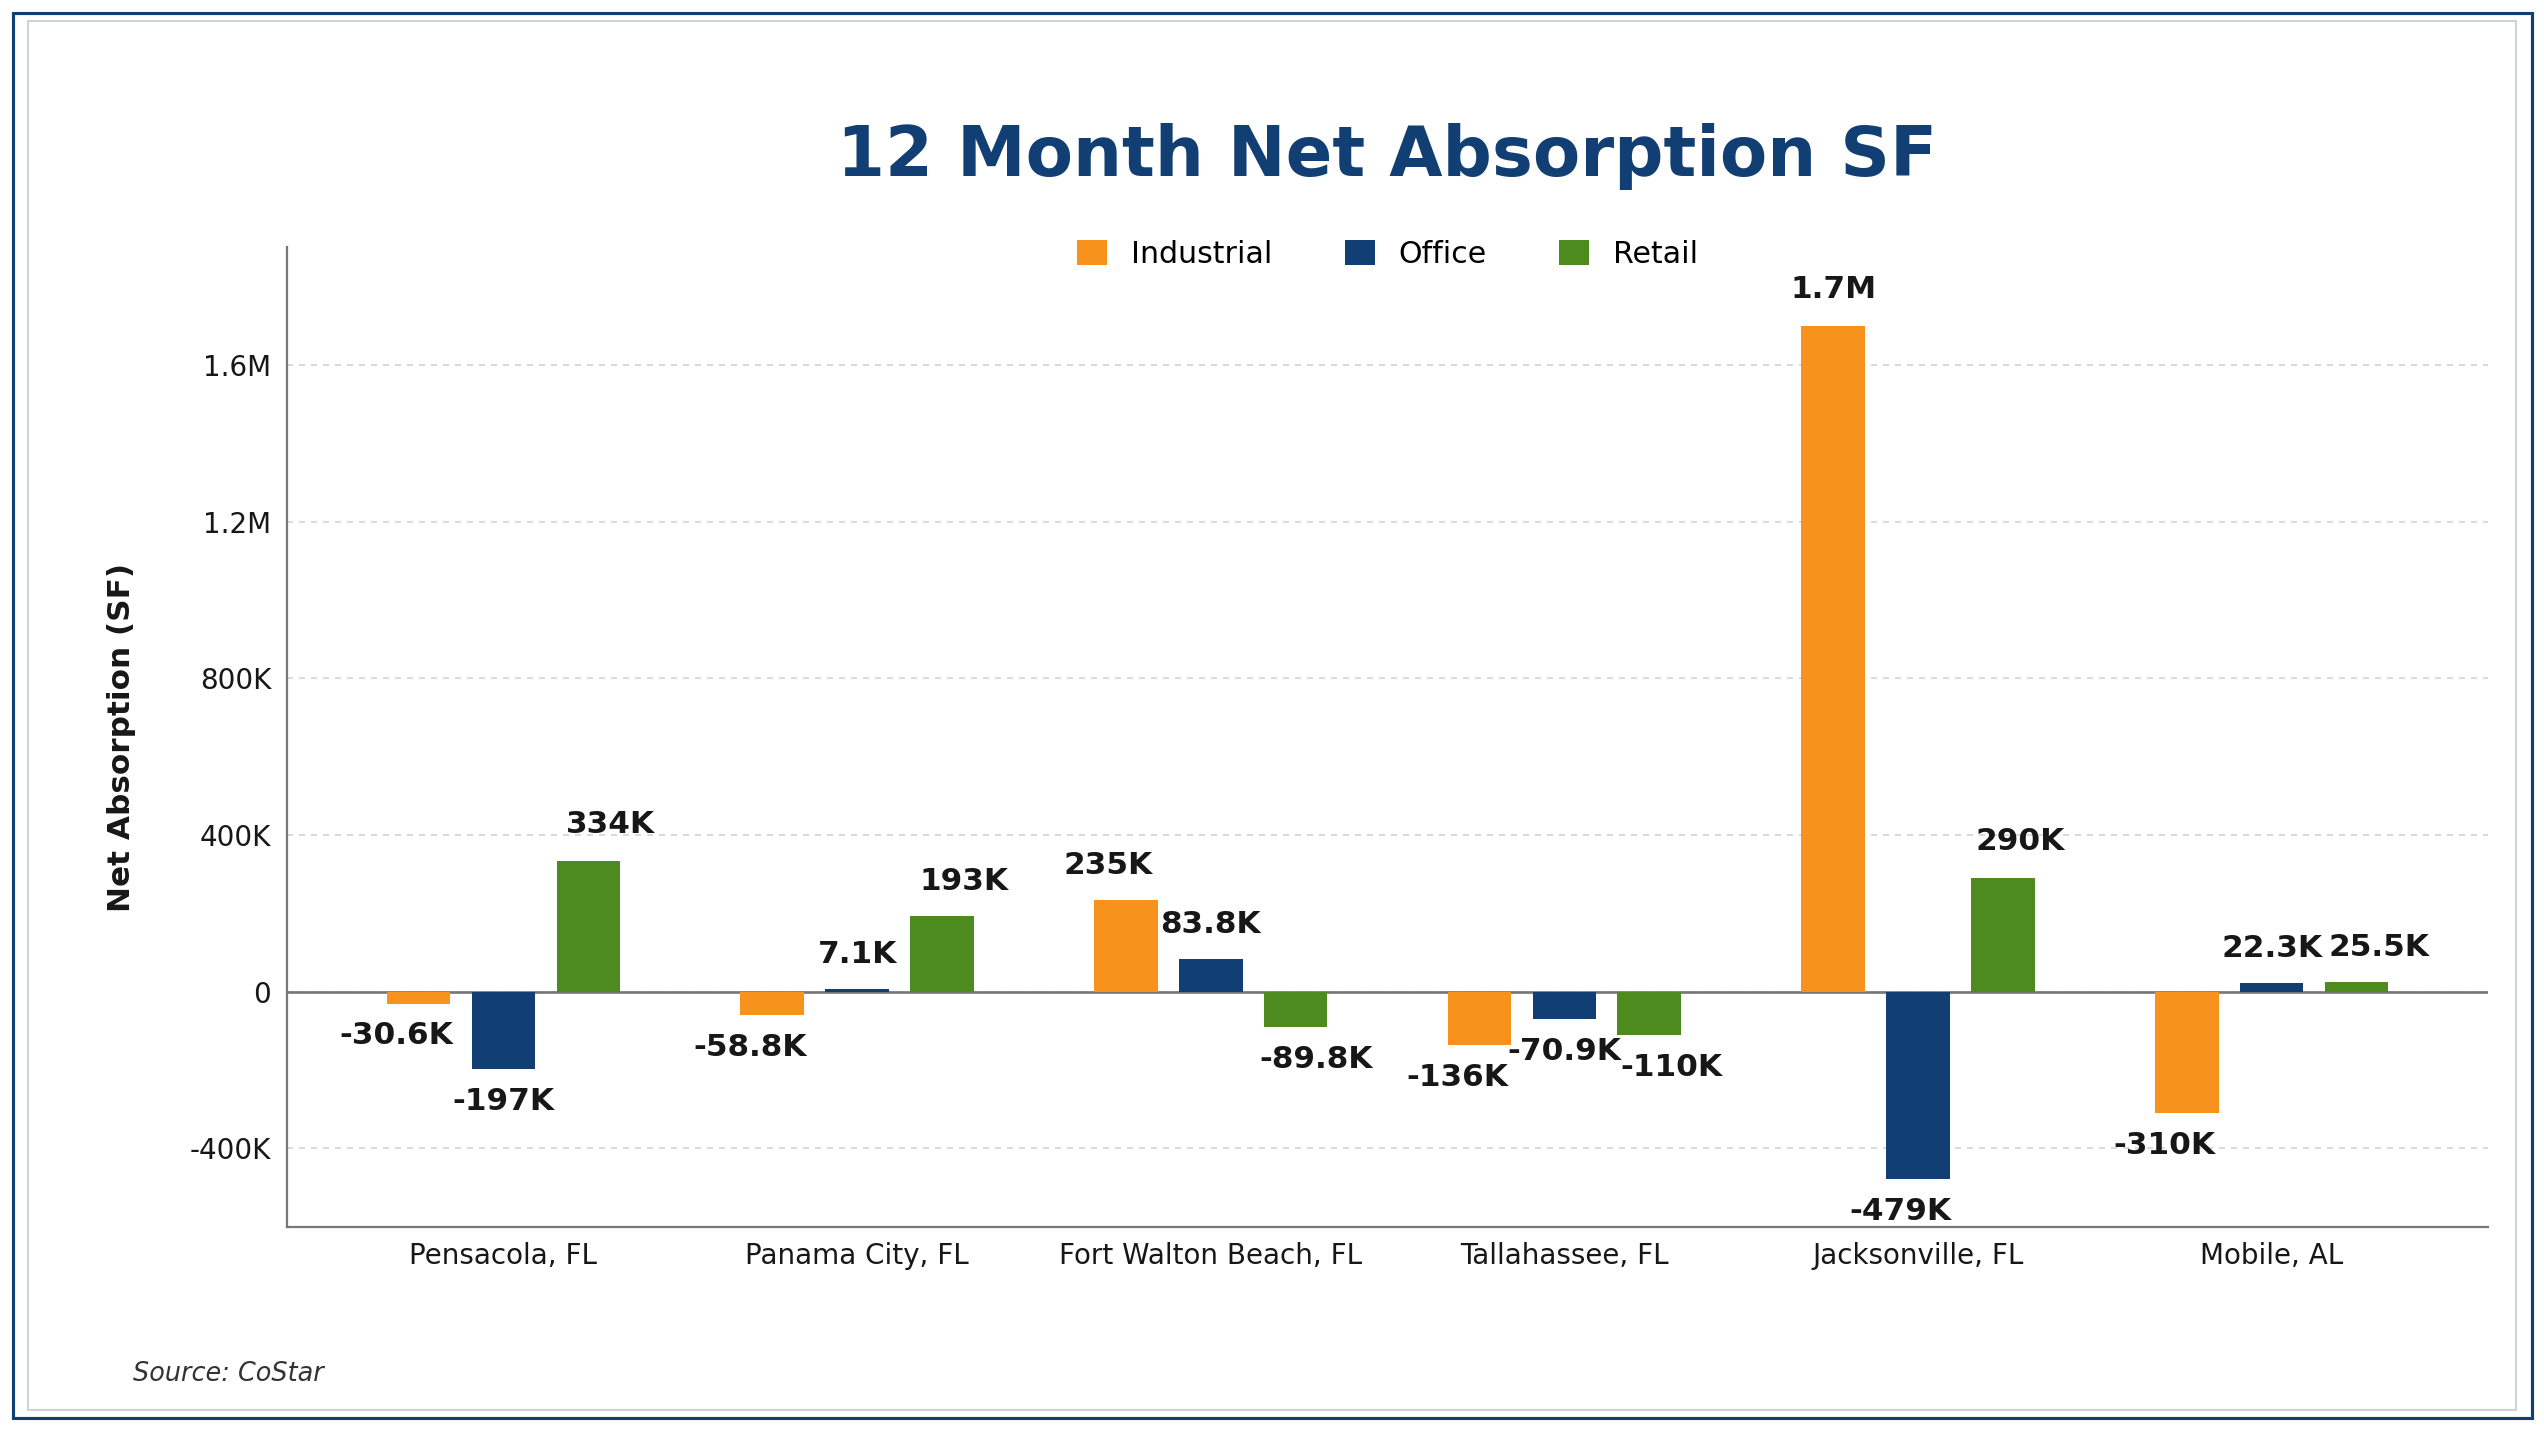
- Jacksonville’s industrial market is the clear demand leader, with 1.7M SF of net absorption, while office recorded -479K SF. The wide difference shows that demand is highly uneven by property type, which matters for owners evaluating asset performance.
- Retail absorption was positive in four of six markets, led by Pensacola (+334K SF) and Jacksonville (+290K SF). This provides a stronger demand signal for retail assets in those markets compared with office.
- Fort Walton Beach posted positive absorption in industrial (+235K SF) and office (+83.8K SF), while retail was negative at -89.8K SF. The data points to stronger demand for the first two sectors than for retail.
- Office demand was negative in Pensacola, Tallahassee, and Jacksonville, with Jacksonville showing the largest decline at -479K SF. For buyers and investors, this reinforces the importance of examining tenant demand and lease rollover rather than relying on market averages alone.
12 Month Deliveries (SF)
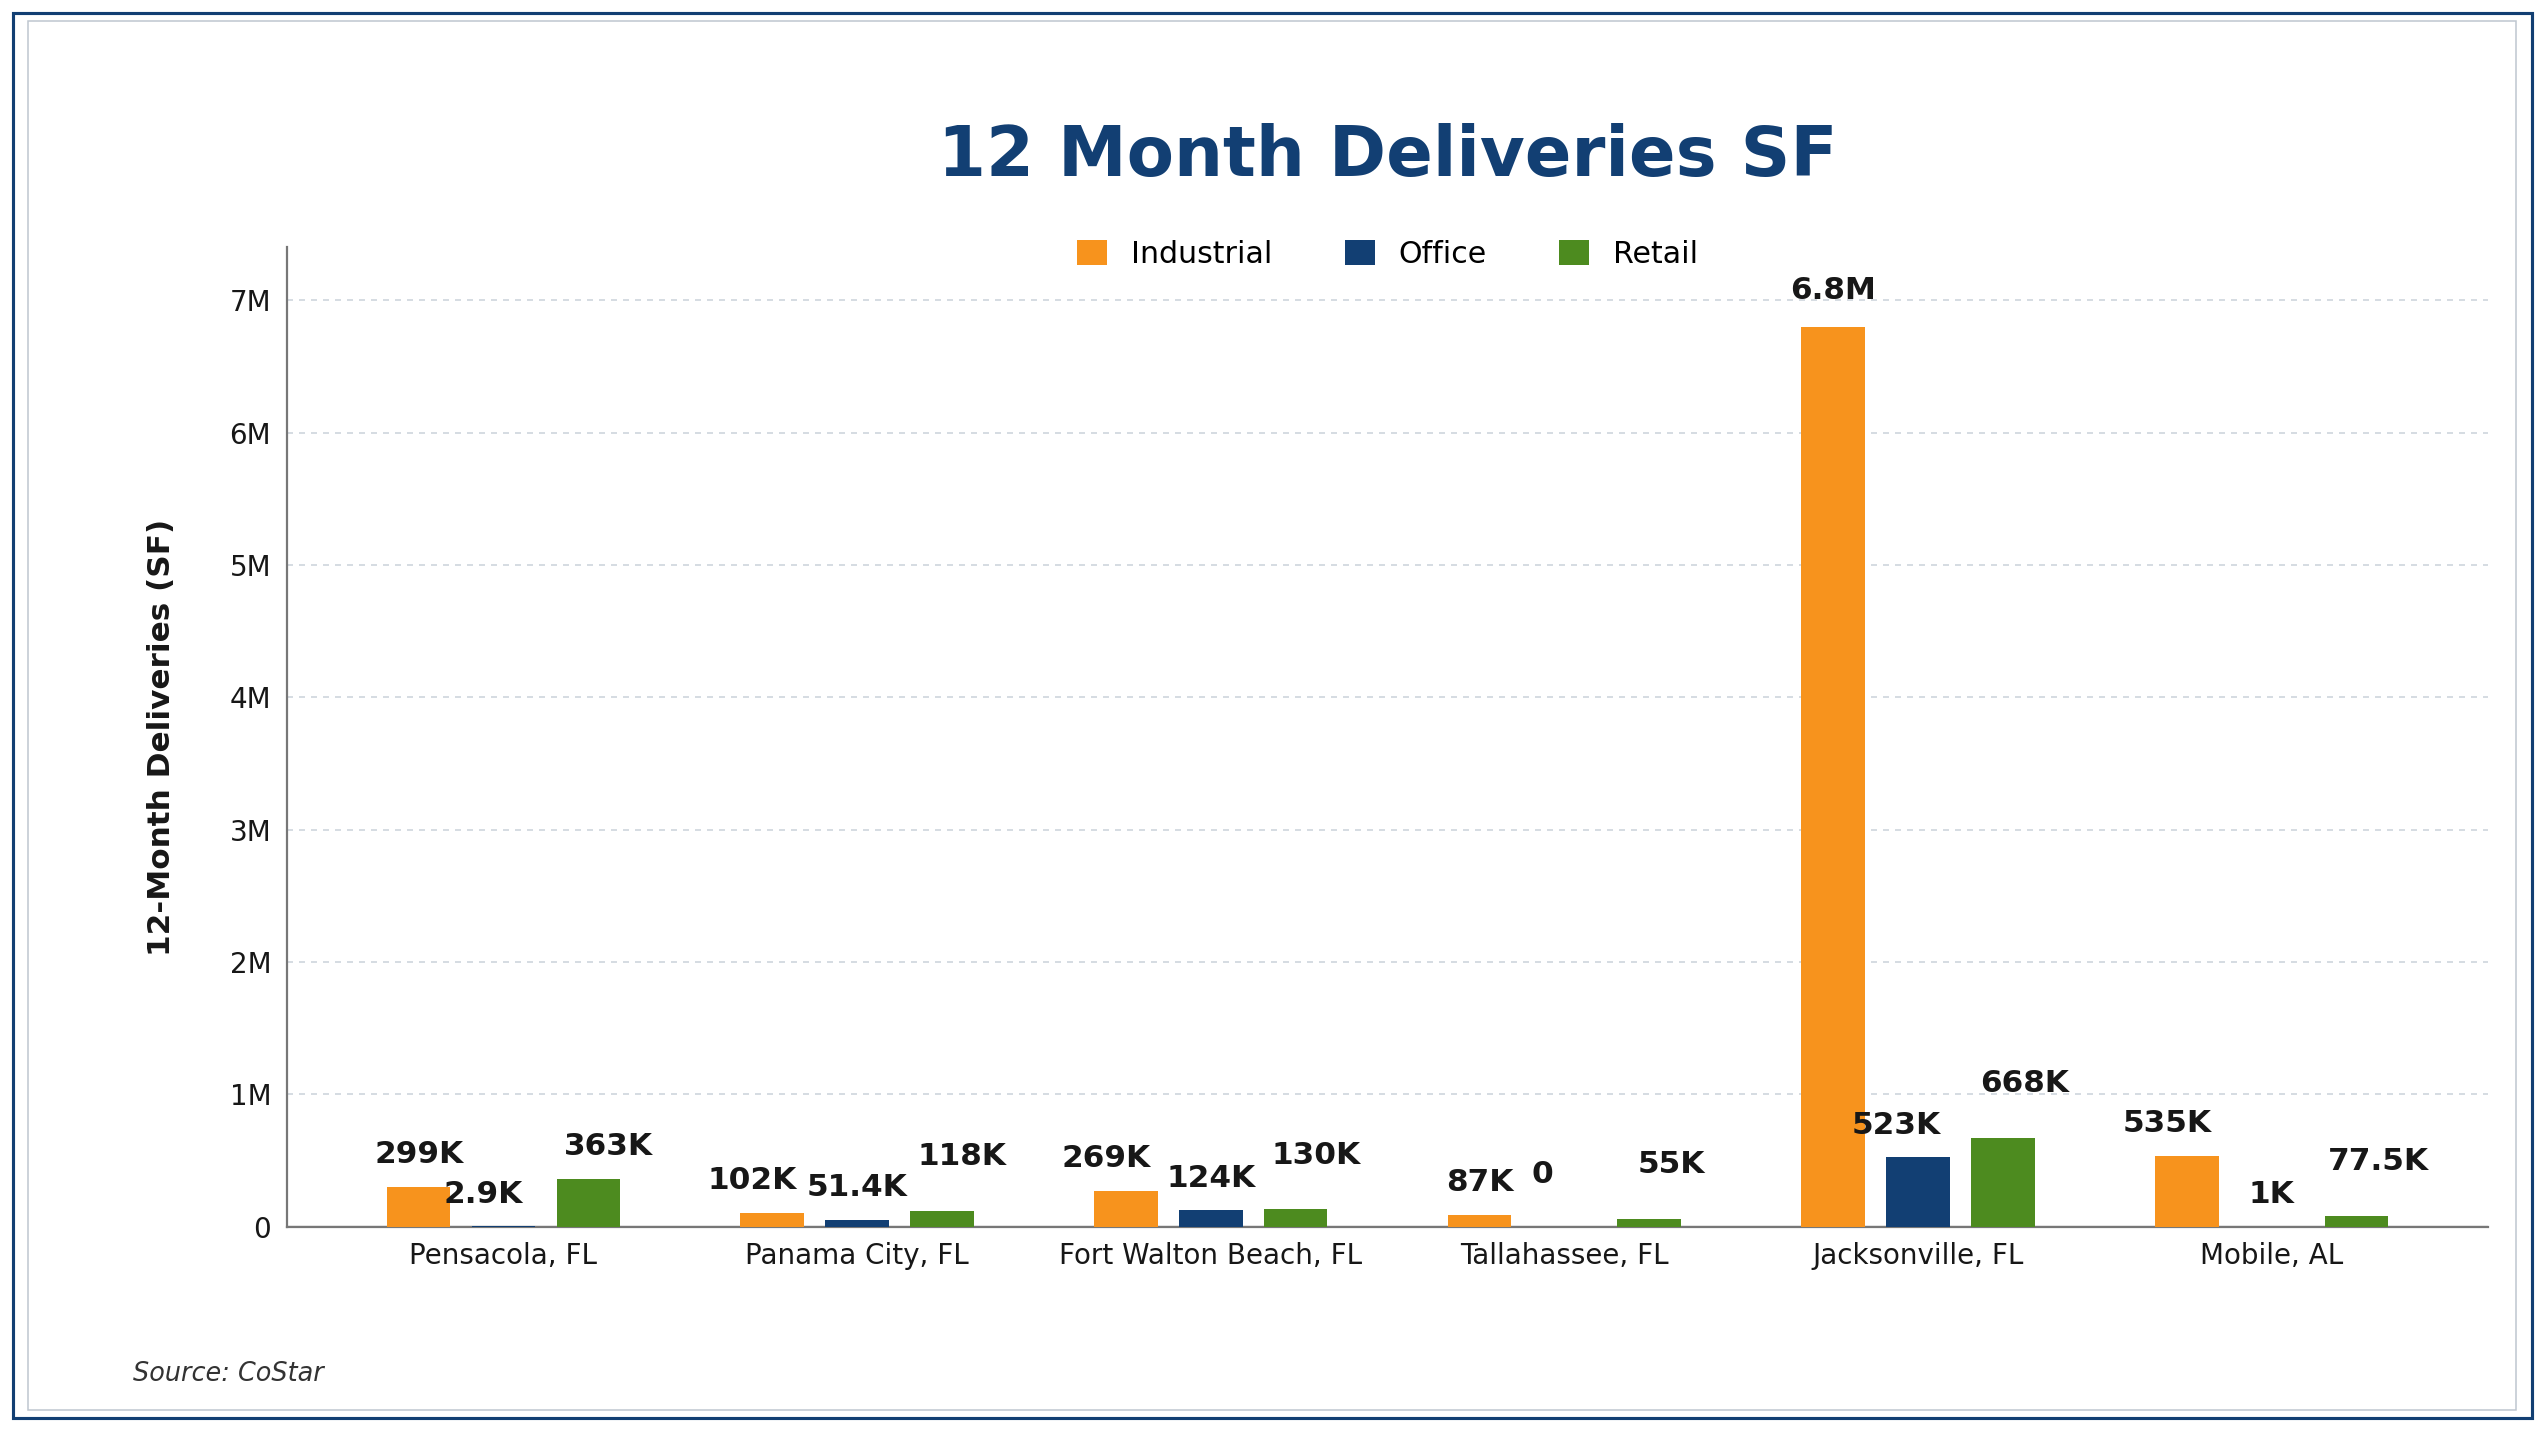
- Jacksonville is experiencing by far the largest volume of new deliveries, with 6.8M SF of industrial space, plus 523K SF of office and 668K SF of retail. This represents a substantial addition to the competitive supply base across multiple property types.
- Industrial deliveries dominate the pipeline, particularly in Jacksonville. Outside Jacksonville, industrial deliveries were much smaller, led by Fort Walton Beach at 269K SF and Mobile at 535K SF. This concentration suggests supply growth is heavily market-specific rather than evenly distributed.
- Retail deliveries were more moderate, with Jacksonville at 668K SF, followed by Pensacola at 363K SF and Fort Walton Beach at 130K SF. Owners and investors should compare these additions with absorption to determine whether new space is being absorbed or increasing competition.
- Office deliveries remain relatively limited, except in Jacksonville (523K SF). Combined with the absorption data, this makes Jacksonville the market where supply-and-demand dynamics deserve the closest underwriting attention.
12 Month Market Asking Rent Growth
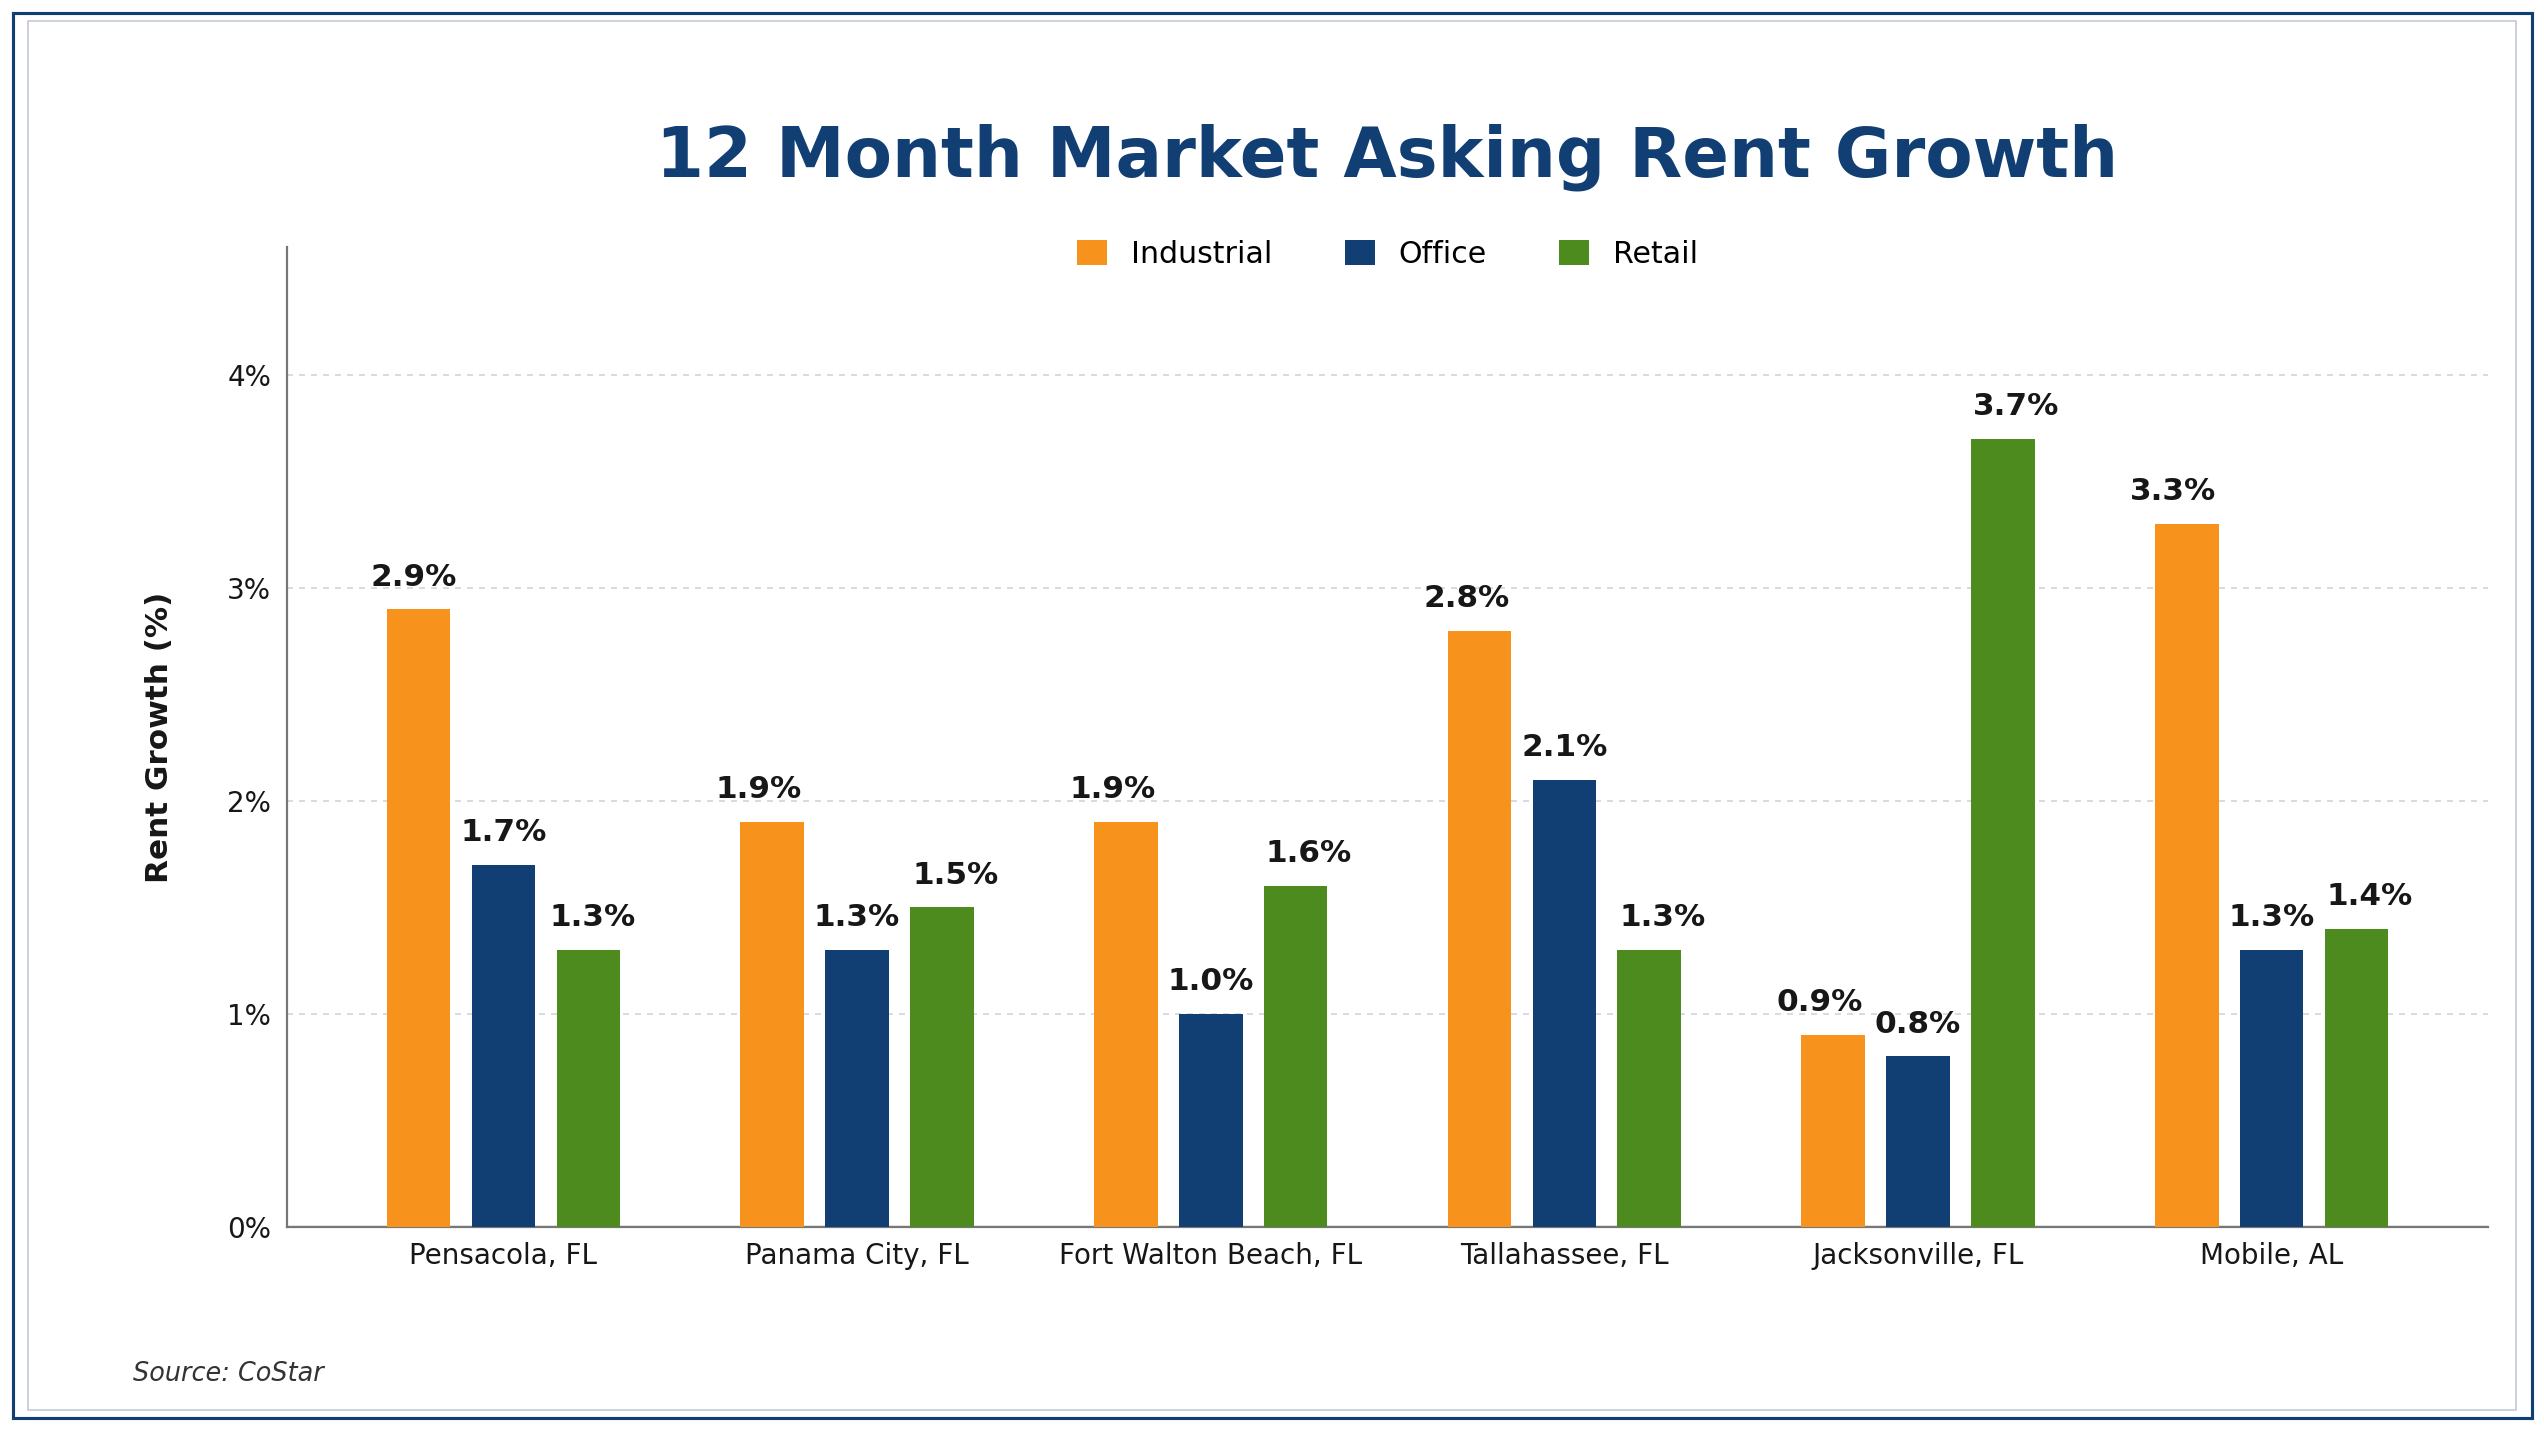
- Industrial asking rents are showing the strongest growth in most markets, led by Pensacola (+2.9%), Tallahassee (+2.8%), and Mobile (+3.3%). For owners and sellers, this supports stronger rent positioning, while buyers should test whether current rent growth is reflected in existing leases or mainly in new asking rents.
- Jacksonville stands out for retail rent growth at +3.7%, the highest retail increase in the group, while industrial and office growth were more modest at +0.9% and +0.8%. This suggests retail is currently showing stronger pricing momentum than the other Jacksonville sectors.
- Office rent growth is positive across every market, ranging from +0.8% in Jacksonville to +2.1% in Tallahassee. For investors and buyers, the relatively consistent growth is a useful supporting indicator, but it should be evaluated alongside office vacancy and absorption trends.
- The data points to different opportunities by market and property type rather than a uniform regional trend. Sellers may find stronger support in sectors with higher rent growth, while buyers should compare rent growth with vacancy, absorption, and new supply before assuming that higher asking rents translate into stronger property-level NOI.
12 Month Sales Volume
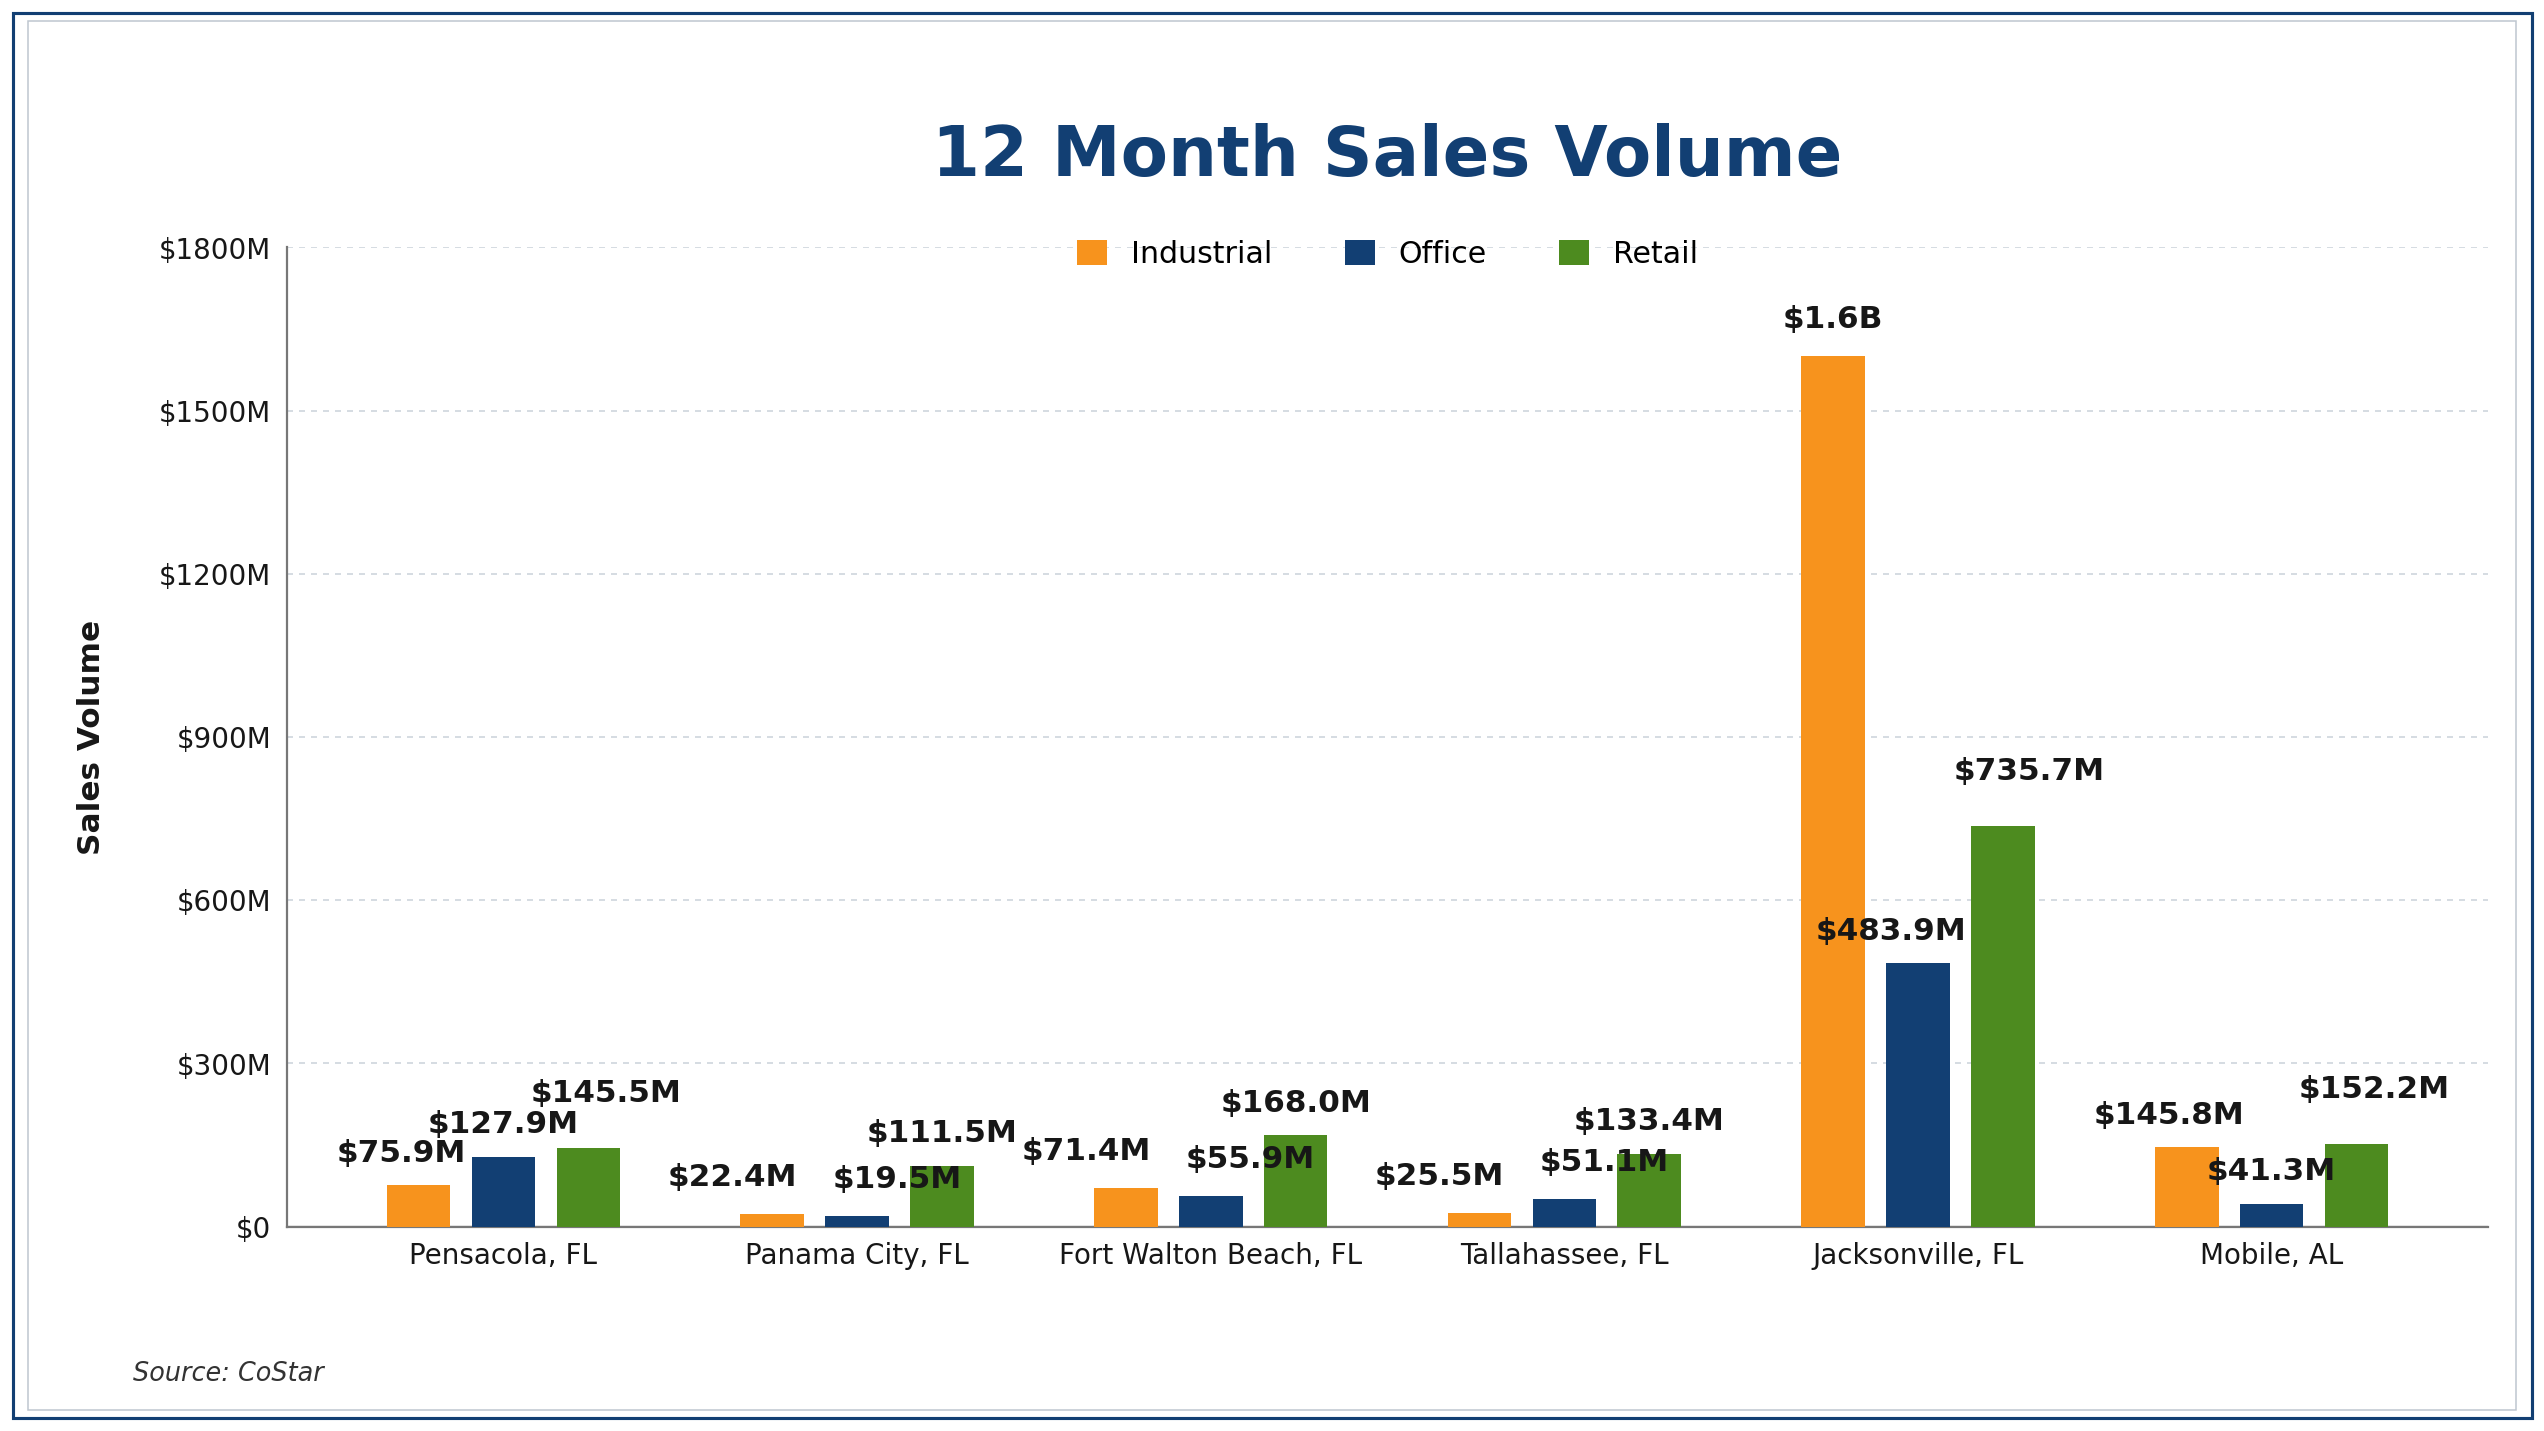
- Jacksonville dominates transaction activity, with $1.6B in industrial, $735.7M in retail, and $483.9M in office sales volume. This makes Jacksonville by far the largest transaction market in the dataset.
- Retail shows meaningful transaction volume across most markets, including $168.0M in Fort Walton Beach, $145.5M in Pensacola, and $152.2M in Mobile. This suggests retail remains an active investment segment beyond Jacksonville.
- Industrial sales are more concentrated, with Jacksonville at $1.6B and Mobile at $145.8M, compared with much smaller volumes elsewhere. Buyers and sellers should recognize that transaction liquidity varies significantly by market.
- The data points to very different investment environments across the region. For owners and sellers, higher sales volume may indicate a deeper pool of transaction activity, while buyers and investors should compare volume with pricing, cap rates, absorption, and asset-level fundamentals before drawing conclusions about market strength.
Estimated Market Cap Rate
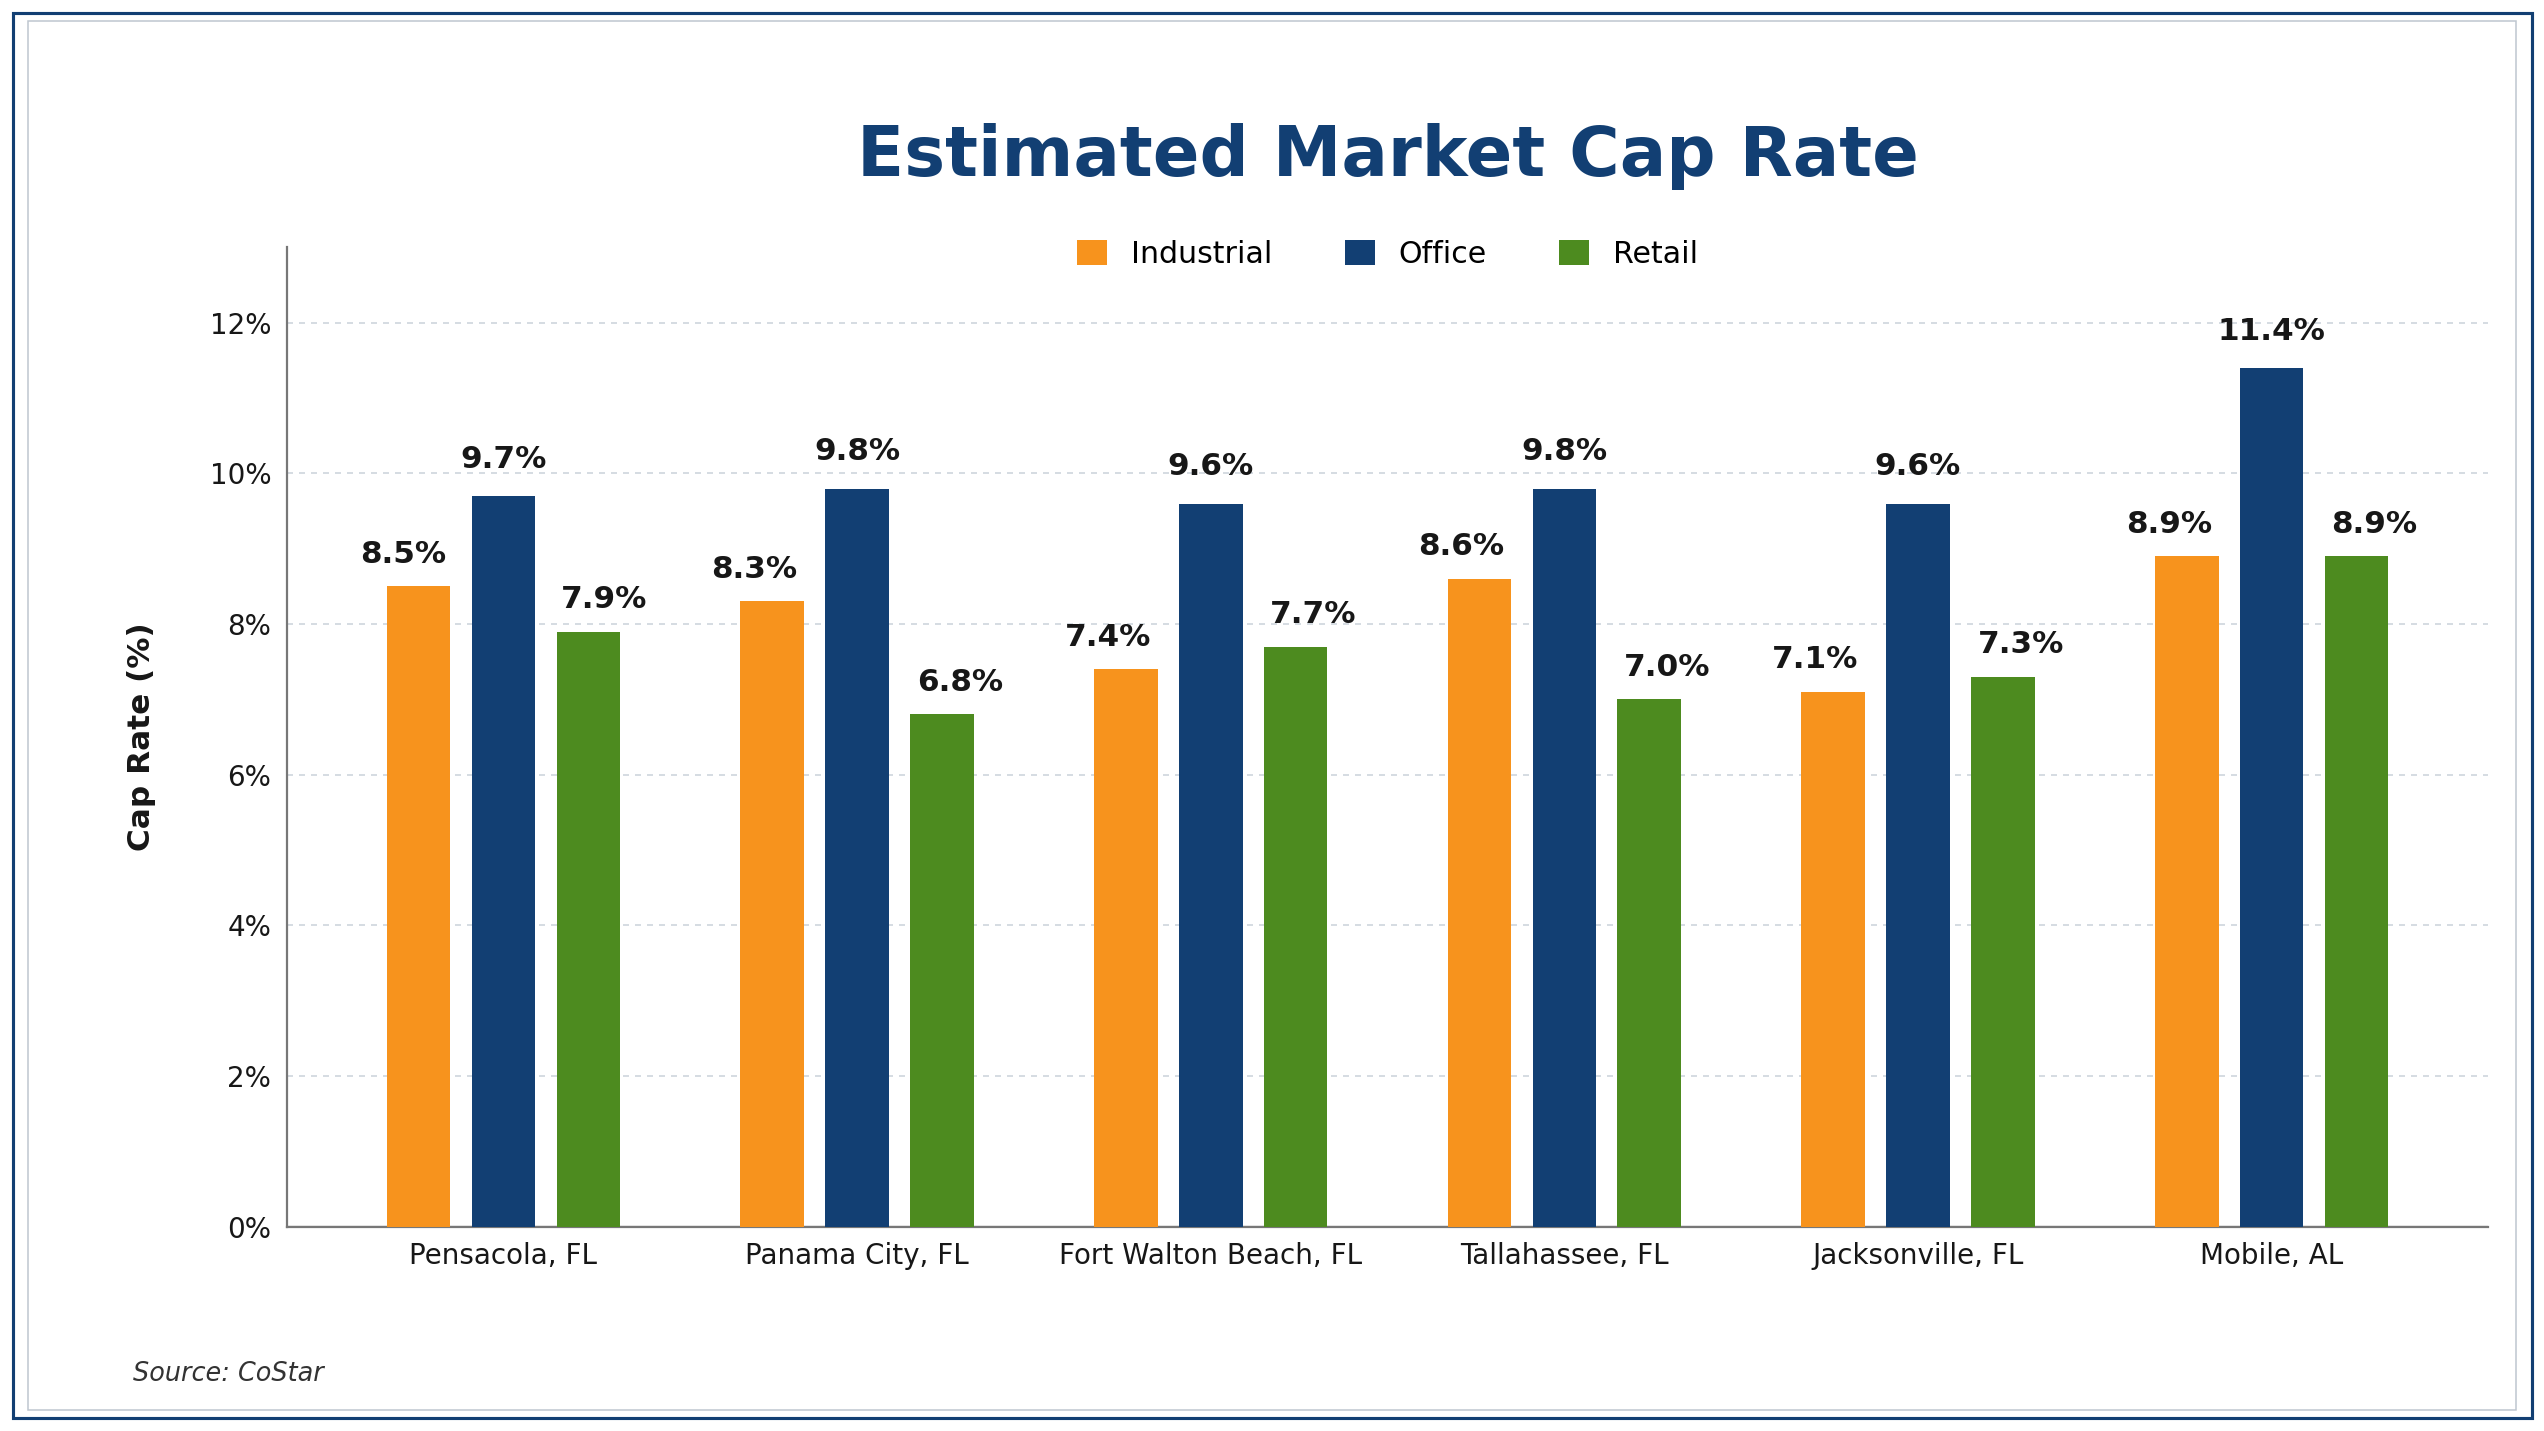
- Office cap rates are highest across all six markets, ranging from 9.6% in Fort Walton Beach and Jacksonville to 11.4% in Mobile. This reflects a higher required yield for office assets relative to industrial and retail in these markets.
- Industrial cap rates are generally in the 7%–9% range, with Mobile at 8.9% and Tallahassee at 8.6%. Buyers and investors may see a wider range of potential yield depending on market and asset characteristics.
- Retail cap rates are generally lower than industrial and office, ranging from 6.8% in Panama City to 8.9% in Mobile. The lower rates indicate that retail assets are being benchmarked at tighter capitalization rates in several markets.
- Mobile shows the widest cap-rate spread, with office at 11.4% versus 8.9% for industrial and retail. For owners, sellers, and buyers, this highlights how valuation expectations can differ substantially by property type within the same market.
Multifamily — September 2026
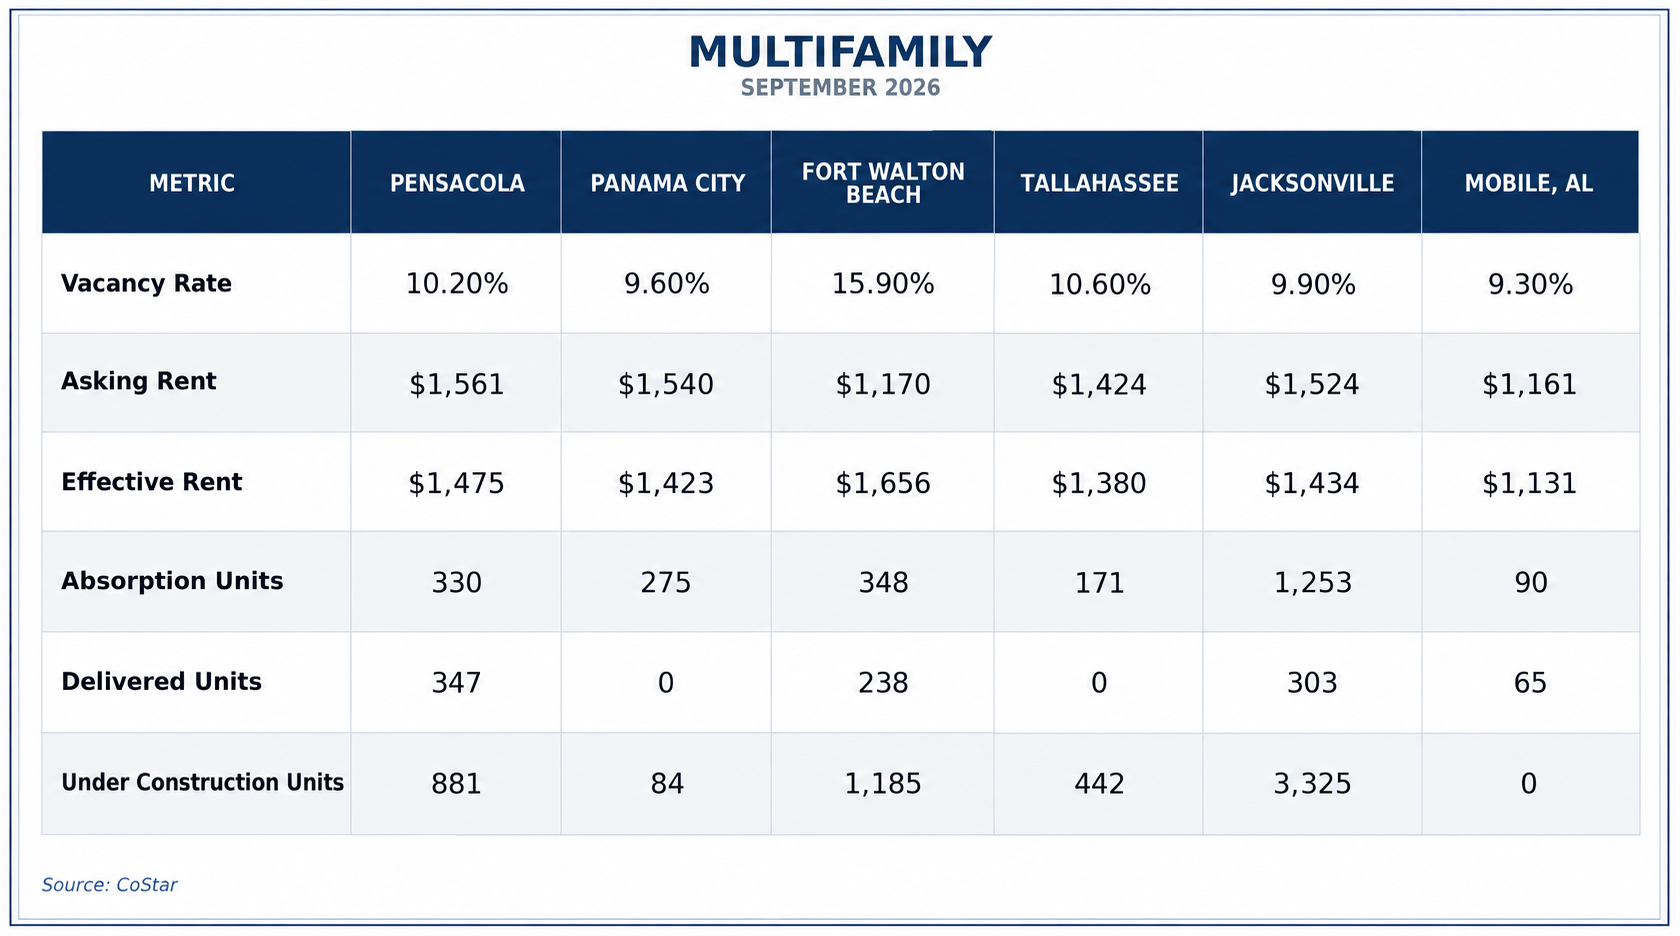
- Fort Walton Beach has the highest multifamily vacancy at 15.9%, well above the other markets. Despite that, effective rent is $1,656, the highest in the group, suggesting owners should look closely at occupancy and pricing together rather than relying on rent levels alone.
- Jacksonville has the strongest unit demand and largest development pipeline, with 1,253 units absorbed and 3,325 units under construction. Buyers and investors should weigh that strong absorption against the amount of new supply coming to market.
- Pensacola and Jacksonville recorded more delivered units than the other markets, at 347 and 303 units, respectively. Pensacola also has 881 units under construction, indicating continued additions to local multifamily inventory.
- Mobile has the lowest vacancy at 9.3% but no units under construction, while Panama City has 84 units under construction and 9.6% vacancy. For owners and buyers, the limited new pipeline in Mobile may be relevant when evaluating future competitive supply.
Multifamily Annual Trends
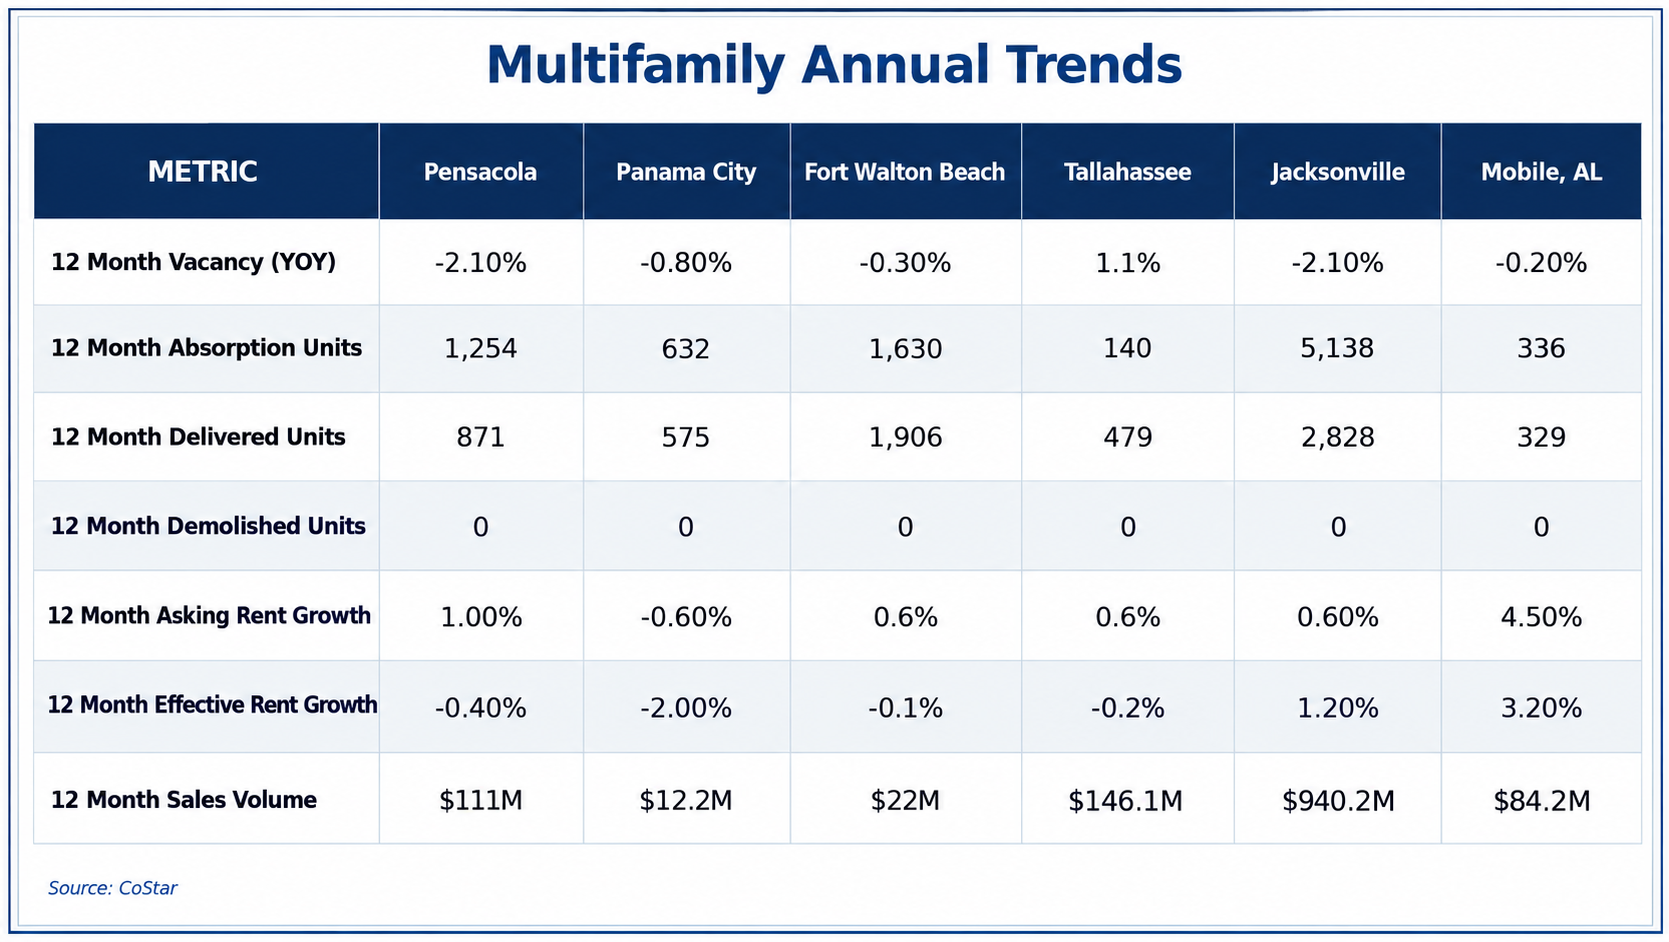
- Jacksonville has the strongest multifamily demand profile in the group, with 5,138 units of 12-month absorption and 1.2% effective rent growth. Its $940.2M sales volume also indicates significantly greater transaction activity than the other markets.
- Mobile shows the strongest rent-growth environment, with 4.5% asking rent growth and 3.2% effective rent growth, the highest in the group. This stands out even though absorption was more modest at 336 units.
- Fort Walton Beach delivered substantial new supply, with 1,906 units delivered, but still recorded 1,630 units of absorption. That relatively close relationship between deliveries and absorption is important for owners and investors evaluating how quickly new inventory is being absorbed.
- Tallahassee and Panama City show softer rent performance, with effective rents declining 0.2% and 2.0%, respectively. For buyers and owners, those markets warrant closer attention to occupancy, concessions, and property-level income performance.
Multifamily Estimated Market Cap Rate
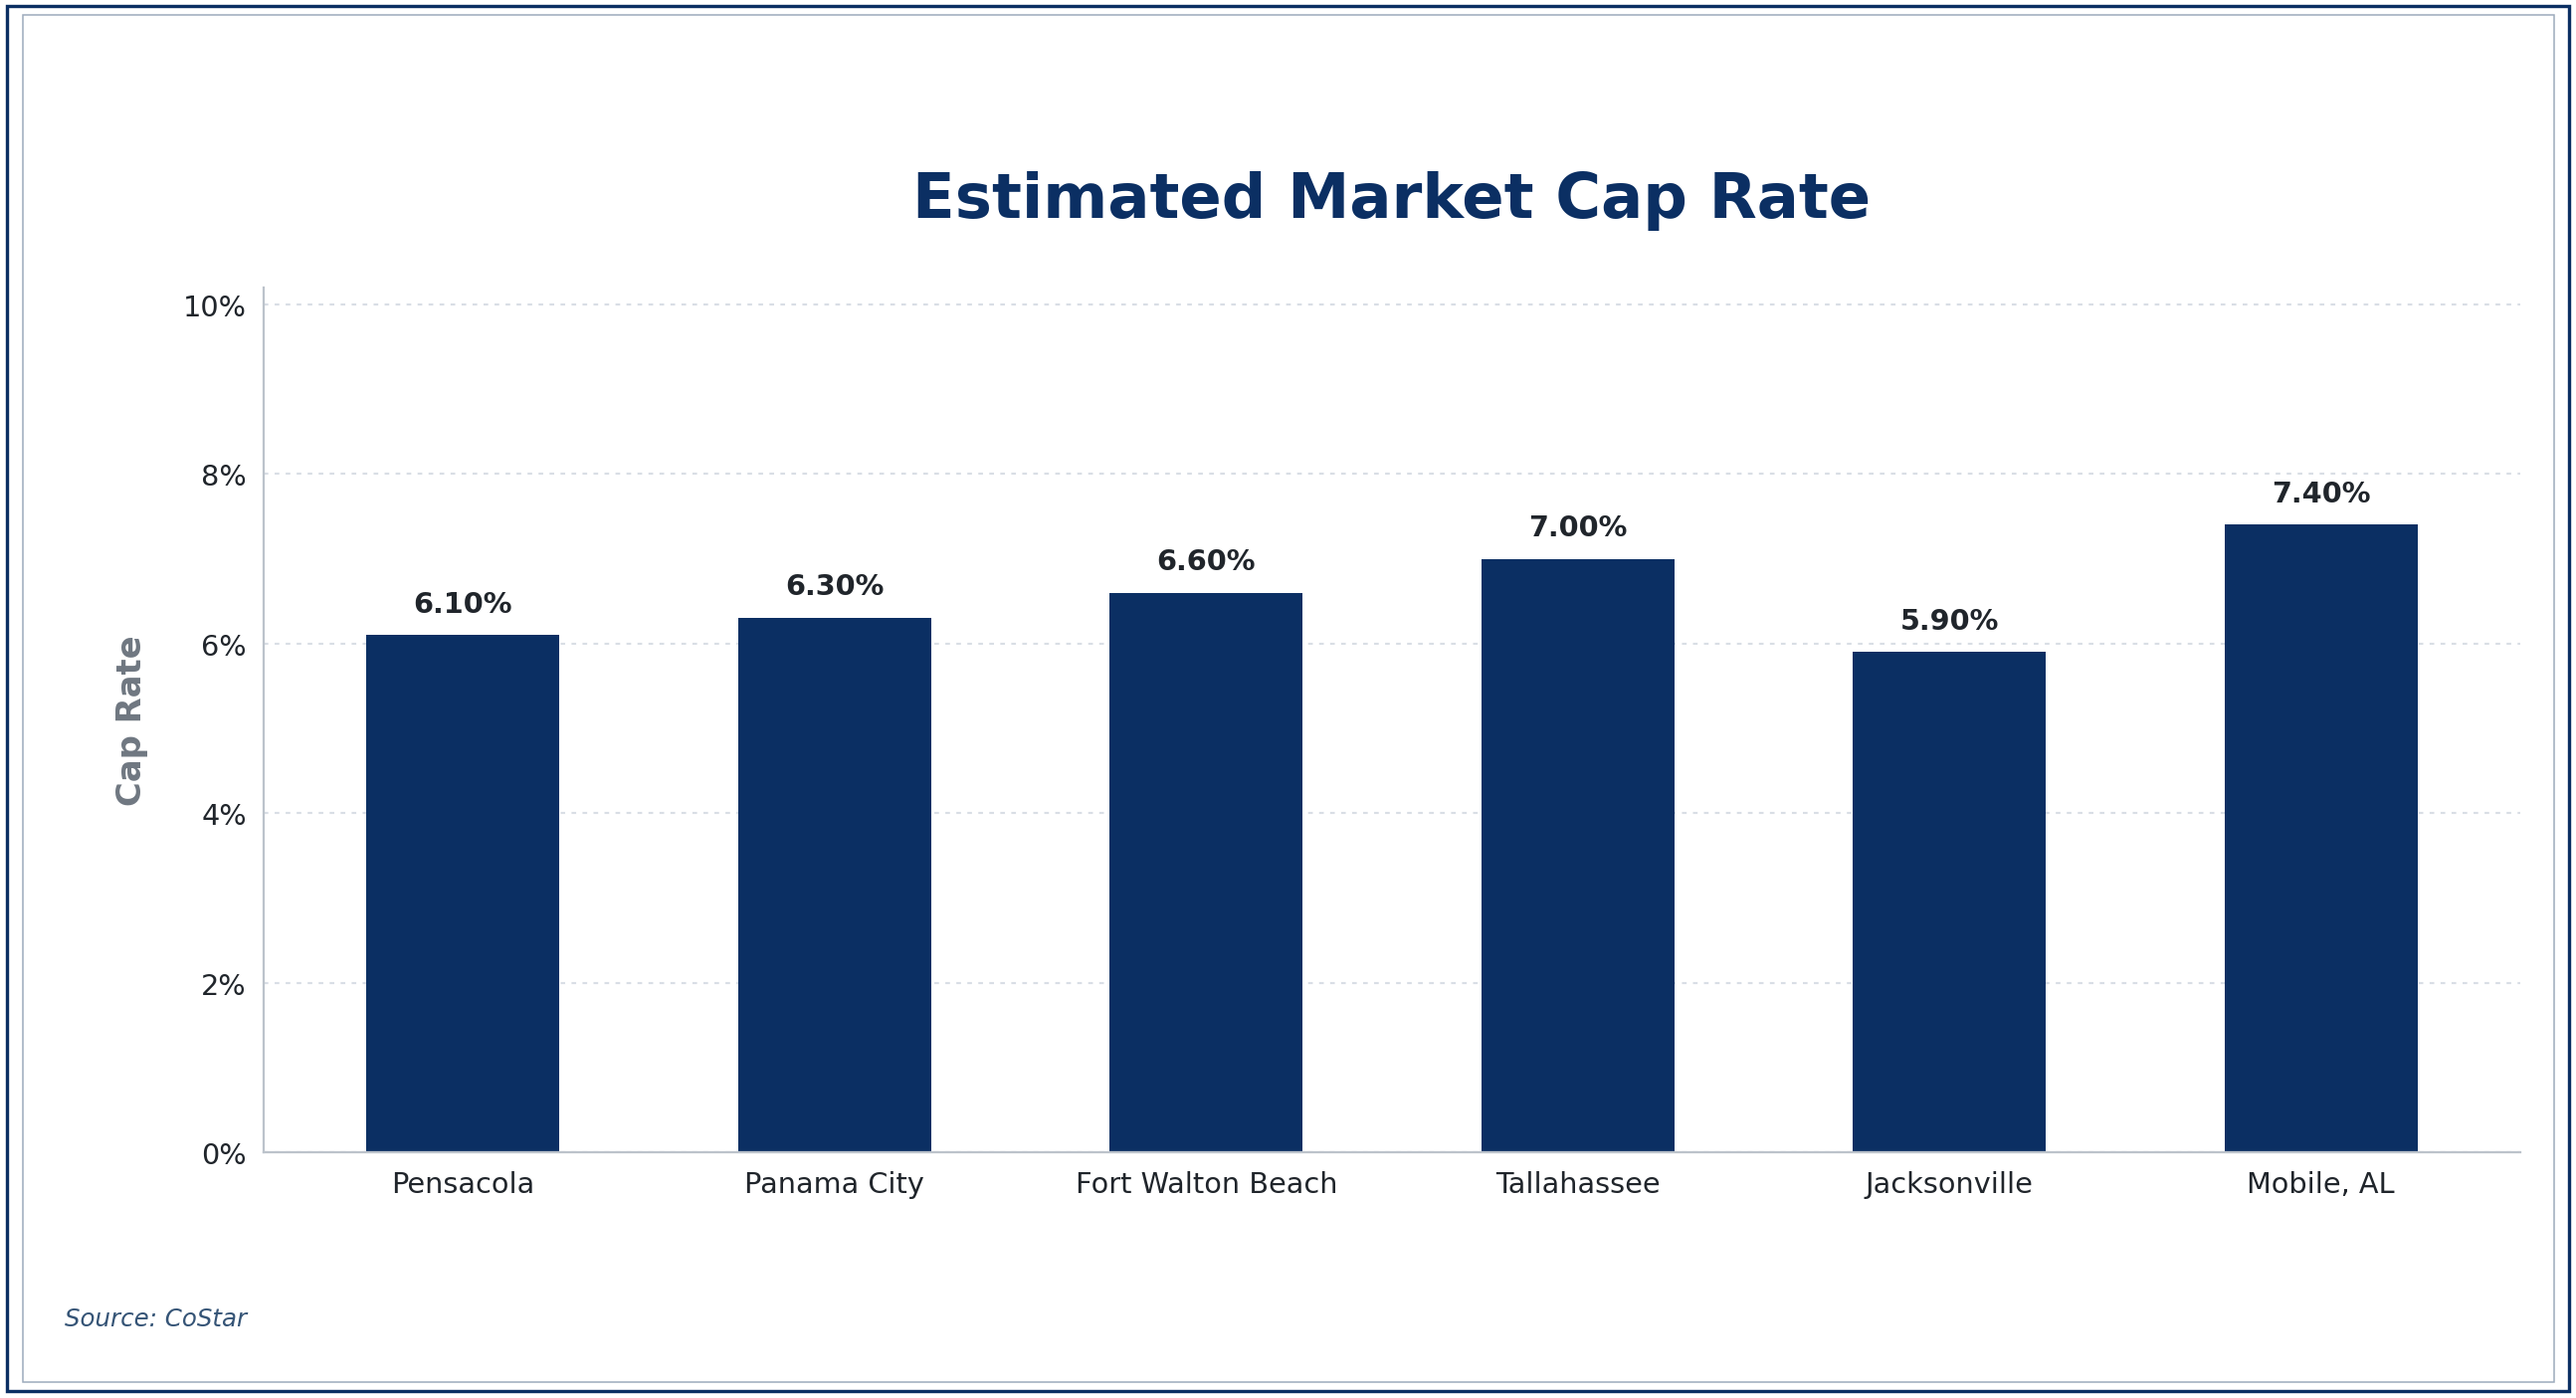
- Mobile has the highest estimated multifamily cap rate at 7.4%, followed by Tallahassee at 7.0% and Fort Walton Beach at 6.6%. At face value, these markets offer higher going-in capitalization rates than the lower-cap-rate markets.
- Jacksonville has the lowest cap rate at 5.9%, followed by Pensacola at 6.1% and Panama City at 6.3%. The tighter cap rates indicate that assets are being benchmarked at lower capitalization yields.
- The spread between the highest and lowest markets is 150 basis points, from 5.9% in Jacksonville to 7.4% in Mobile. That creates a meaningful difference in how NOI translates into implied property value.
- For buyers and investors, cap rate should be evaluated alongside vacancy, rent growth, absorption, and new supply. For owners and sellers, the applicable market cap rate can materially affect valuation, so property-specific performance remains important when comparing against these benchmarks.
Overall Takeaway
The September data points to a highly uneven CRE market across the Gulf Coast, rather than a single regional trend. Jacksonville is clearly the largest and most active market, with the highest sales volume, significant industrial and retail absorption, and the largest development pipeline. At the same time, its rising vacancy and negative office absorption show that strong transaction activity does not translate evenly across property types.
- Industrial remains the strongest growth story in several markets, but vacancy is rising across all six markets. Jacksonville and Mobile also have substantial industrial supply under construction, making future absorption critical.
- Retail fundamentals appear relatively resilient. Vacancy remains comparatively low in several markets, rent growth is positive across the board, and retail posted positive absorption in four of the six markets.
- Office is the most inconsistent sector. It carries the highest asking rents and generally higher cap rates, but vacancy increased in most markets and absorption was negative in Pensacola, Tallahassee, and Jacksonville. This creates a wider gap between pricing potential and underlying leasing performance.
- Capital is clearly concentrated in Jacksonville. Its $1.6B industrial, $735.7M retail, and $483.9M office sales volumes far exceed the other markets. For owners and sellers, this points to a deeper transaction environment; for buyers, it also highlights the importance of separating market liquidity from property-level fundamentals.
- Multifamily tells a similarly mixed story. Jacksonville has the strongest absorption and sales activity but also the largest construction pipeline, while Mobile has the strongest rent growth. Fort Walton Beach has the highest vacancy despite having the highest effective rent, showing why vacancy, rent, supply, and absorption need to be evaluated together.
Bottom line: The data supports a market-by-market, asset-by-asset approach. Rent growth and transaction activity remain present, but rising vacancy in several sectors and significant new supply mean owners, sellers, buyers, and investors need to focus closely on absorption, lease-up, competing inventory, and property-level income performance, not just headline market averages.
If you're looking to explore investment opportunities along the Gulf Coast, contact Gulf Coast Property Group at (850) 203-5788 or visit Investment Partnerships.